Why do we prioritize climate?
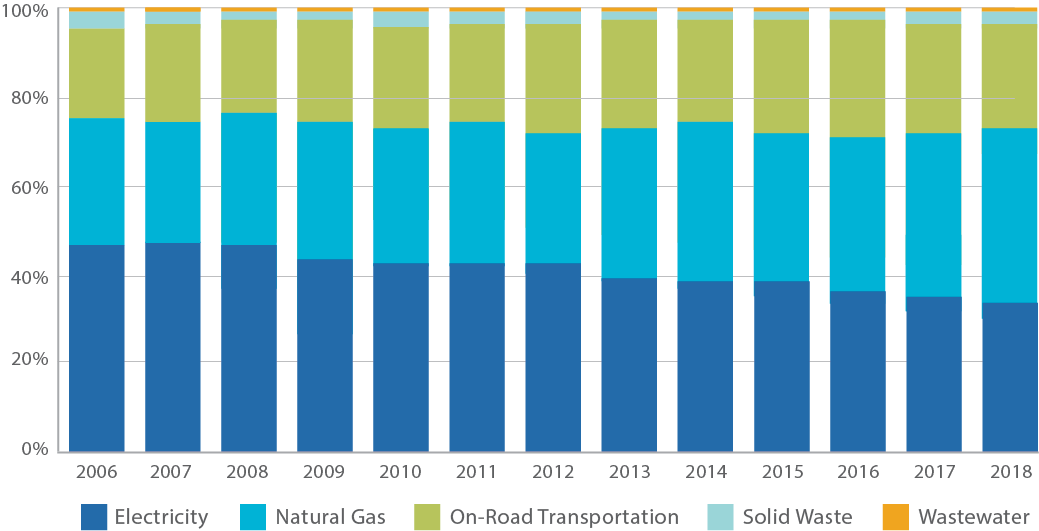
Minneapolis has set a goal of reducing our greenhouse gas emissions by 80% by the year 20501 Emissions from on-road transportation account for approximately 24% of greenhouse gas emissions in Minneapolis.2 Even with mass adoption of electric cars, Minneapolis will need to reduce automobile passenger miles by 38% to reach our goal of reducing greenhouse gas emissions by 80% by 2050.3
To reach our citywide climate goals, we will need to change how we move around. We will need to improve options for transit, walking and bicycling, and we’ll need to rapidly electrify fleets. As our population continues to increase, every effort will support reducing miles traveled in single occupancy and high carbon vehicles because the health of our city and our climate depends on it.
There is an unmistakable link between climate and equity. Freeway systems were built in the Twin Cities throughout the 1950s, 60s, 70s and 80s, resulting in bifurcated neighborhoods, barriers for those walking, biking and driving, and concentrated emissions pollution in the residential neighborhoods that remained. The neighborhoods these highways went through were often poorer and housed communities of people of color. Areas deemed as hazardous (often housing people of color, immigrants and Jews) in the Home Owner's Loan Corporation maps (redlining maps) occupied 17% of land area but contained 48% of the freeway length in Minneapolis4
Exposures to nitrogen dioxide levels, as one indicator, are 38 percent greater nationally for minority neighborhoods than in white neighborhoods; Minnesota is the state with the 15th worst exposure gap between people of color and whites.5 Past redlining policies are also linked to acute differences in neighborhood temperatures - another persistent climate challenge linked to race. Land use and street design decisions that led to more impervious surface and less green cover in areas of the city create a lasting impact; even today, neighborhoods in Minneapolis can face a 10 degree difference in heat depending on green coverage.6 By facing climate, we also face historic inequities created by our transportation system.
Citywide emissions by type: Transportation accounts for 24% (2018)

Source: Citywide Greenhouse Gas Emissions Inventory (2018)
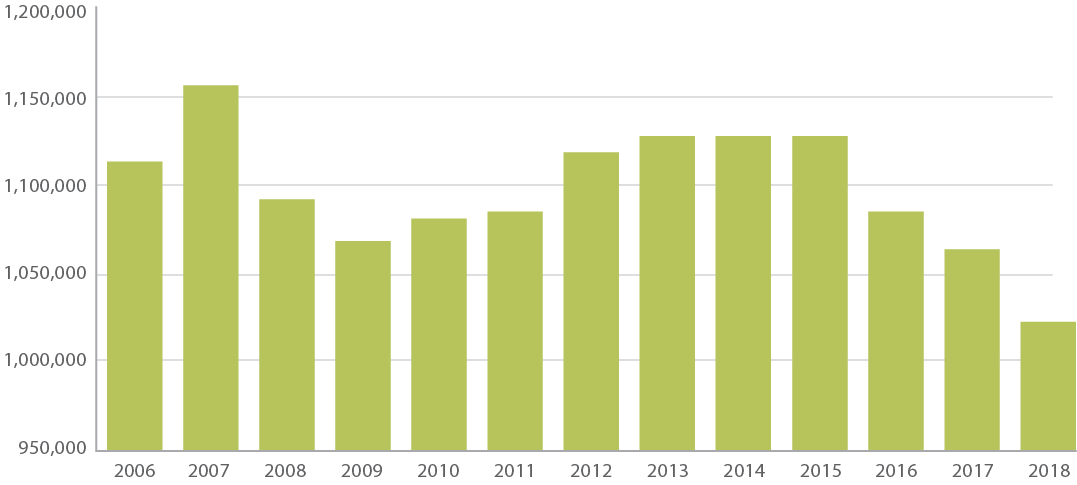
Total emissions (metric tons of carbon dioxide) from on-road transportation

Source: Citywide Greenhouse Gas Emissions Inventory (2018)
1 City of Minneapolis Climate Action Plan (2014)
2 City of Minneapolis Greenhouse Gas Emissions by Citywide Activities (2016)
3 Minneapolis 2040
4 Institute for Metropolitan Opportunity, University of Minnesota Law School.
5 https://www.mprnews.org/story/2014/04/15/air-pollution-disparities
6 "Racist housing policies have created some oppressively hot neighborhoods", National Geographic
Even with the adoption of electric cars, Minneapolis will need to reduce automobile passenger miles by 38 percent to reach our goal of reducing GHG by 80 percent by 2050.

 CLIMATE