Making & Monitoring Progress
Monitoring progress: key metrics to measure progress on our plan
Monitoring progress: key metrics to measure progress on our plan
This plan lays out specific strategies and actions that are intended to be completed over the next 10 years. The most basic way to measure progress is by documenting the completion of the actions laid out in this plan.
Equity
The TAP details strategies and actions that will, if implemented, help to reverse racial disparity trends, eliminate institutional racism and ensure that outcomes and opportunities for all people are no longer predictable by race. The most affordable transportation options will be more widely available to more people and people will not be as burdened by the costs of daily travel.
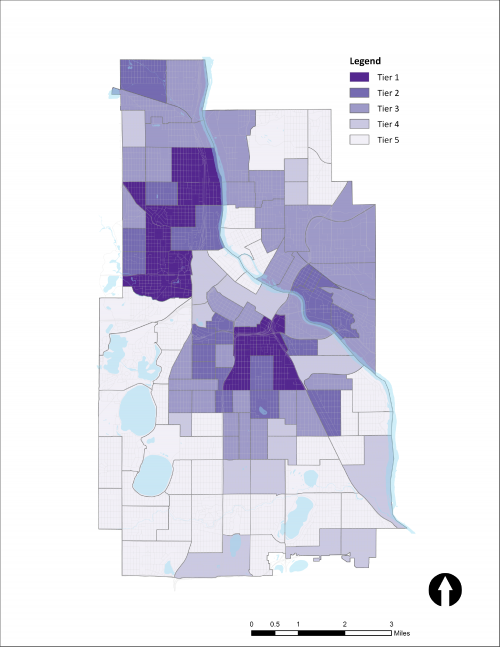
There are four key metrics detailed below. The goal is to have each of them progress within Transportation Equity Priority (TEP) area tiers 1 and 2 at a rate equal to or greater than the citywide rate. TEP areas replace the previous use of ACP50 as the standard way to define geography-based equity areas for transportation efforts in Minneapolis. TEP scoring considers a broader range of demographic, socioeconomic, and other factors. The resulting TEP scores for Census tracts across the City are grouped into five tiers, with the highest scoring census tracts designated TEP tier 1, the next-highest scoring as TEP tier 2, and so on.
Transportation Equity Priority Tiers, as of 2025
Goal:
100% actions completed or in progress by 2030
Baseline:
Will be measured from 2020 moving forward
There are 56 strategies and 304 actions across 7 topic areas and 3 strategies and 20 actions in the Progress section of the TAP. We will track progress on these strategies and actions as: completed, in progress, or not yet started. Our goal is to have 100% of the actions completed or in progress by 2030. We acknowledge that some are more difficult to accomplish than others and that conditions will change over the next 10 years. There will be some things we set out to do that will remain undone at the end of 10 years, due to changing priorities, lack of partnership opportunities or better ideas replacing what is laid out in this plan.
Goal:
100 miles of pedestrian realm improvements; 3,800 pedestrian intersection corner improvements
Baseline:
Will be measured from 2020 moving forward
To measure success in pedestrian improvements, we look to measure two separate but related metrics: miles of pedestrian realm improvements and number of pedestrian intersection improvements. Pedestrian realm improvements include sidewalk replacement or filling of gaps and installation of boulevards or pedestrian lighting. Pedestrian intersection improvements include the number of corners with curb extensions and ADA ramps.
Goal:
100% of the network, 286 miles
2019 Baseline:
146 miles exist on the All Ages and Abilities Network
The All Ages and Abilities Network consists of 286 miles. The goal is to complete the entire buildout of this network by 2030. 146 miles of this network already exist, and 141 miles needs to be built, some of which will be upgrades from existing striped bike lanes1.
Goal:
All 25 corridors identified in the plan
Baseline:
Will be measured from 2020 moving forward
Many improvements to transit depend on operational and design changes on our streets that prioritize transit. Tracking and reporting on the number of corridors where transit priority improvements have been installed is a key metric to measure progress on the plan.
The TAP identifies 25 corridors for transit priority projects, including:
- Bus-only lanes and/or transit advantages on 7 corridors:
- 4th Avenue South between Washington Avenue and 10th Street South
- 5th Avenue South between Washington Avenue and 10th Street South
- 6th Street North/South between 1st Avenue North and 13th Avenue South
- 7th Street North/South between 1st Avenue North and 13th Ave South
- 8th Street North/South downtown between 1st Avenue North and 13th Ave South
- 4th Street from the west/freeway connections to Marq2
- 12th Street South between I35-W and Marquette Avenue South
- New high frequency neighborhood-based transit on 3 corridors:
- Nicollet-Central corridor
- Midtown Greenway from West Lake Station on the Green Line Extension to Lake Street Station on the Blue Line
- West Broadway from downtown Minneapolis to the northwest suburbs
- Transit priorities on 15 corridors. These corridors may be prioritized for increased service, transit signal priority or preemption, a bus-only lane or other improvements.
- Marshall St NE – between Broadway St NE and Lowry Ave NE
- Lyndale Ave N – between West Broadway and northern city boundary
- Lowry Ave –western city boundary to eastern city boundary
- West Broadway Ave/Broadway Street NE – extend from Lyndale Avenue N to the eastern city boundary
- Como Ave SE – between University Ave SE and eastern city boundary
- 38th St – Bryant Avenue S to 42nd Avenue S
- Xerxes Ave to 46th Street Station - traveling along 50th Street W, Bryant Ave S, 46th St E, Cedar Ave, 42nd St E, 28th Ave S, 46th St E
- Lyndale Avenue S – Hennepin/Lyndale merge near Loring Park to southern city boundary
- Washington Avenue – West Broadway to Cedar Avenue continuing to 46th Street
- 2nd St N – Hennepin Avenue to Dowling Avenue
- Johnson St NE – Hennepin Ave to 37th Ave NE
- Xerxes Ave – 44th St W to 54th St W
- 28th Ave S – 38th St E to 58th St E
- 4th Street SE and University Ave SE – Central Ave to 27th Ave SE
- Glenwood Ave/Penn Ave – N 10th St to Olson Memorial Highway
Learn how we make progress on the action plan
1: The actual lane miles of existing bikeways is 145.58 miles and was rounded to 146. The actual lane miles of planned is 140.59 miles and was rounded to 141. The sum of actual lane mileage of existing and planned bikeways is 286.17 and was rounded to 286