Introduction
How people move in Minneapolis
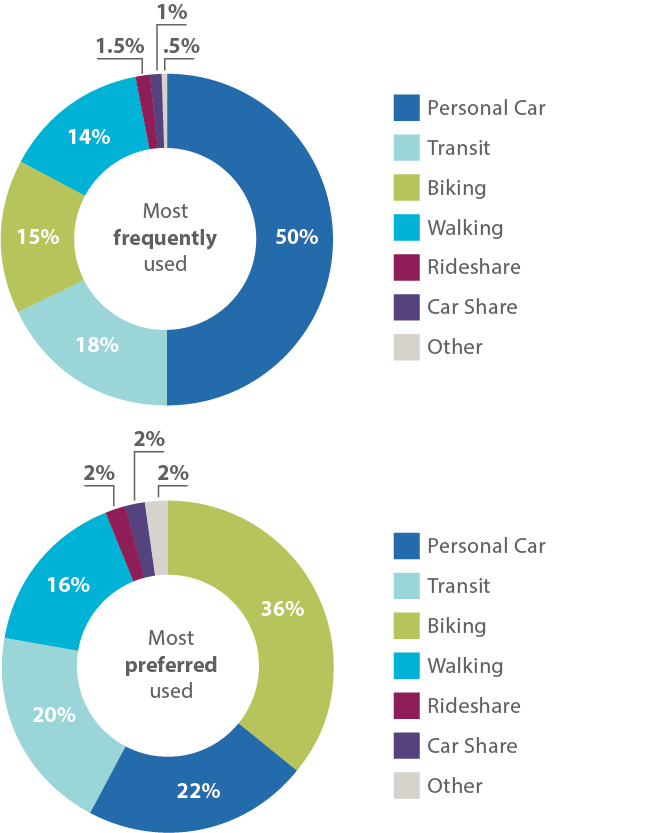
We surveyed over 5,000 people during the summer of 2018 to ask how they most often travel, and how they would prefer to travel. What we heard was that half typically travel by car (50%), but many of those same people would prefer to travel more by biking (36%) and transit (22%). Every category (transit, biking, walking, rideshare, car share and other) saw an increase in desired travel mode versus current way of travel except for the private car.
The City has several policies that aim to provide people with a wide variety of transportation options that are safe, sustainable, convenient and accessible. This includes Minneapolis 2040, our Complete Streets Policy, our Climate Action Plan, and our Vision Zero Policy. One of the commonalities between these plans and associated policies is that they all aim to reduce the number of trips that people take in single occupancy vehicles.
Trends from various sources show that we are making progress toward reducing single occupancy vehicle trips. Despite a growth in population we have managed to keep the number of vehicle miles traveled at the same level, which shows that people are driving less per capita1. Based on our annual bicycle and pedestrian counts we have seen steady increases at our count locations over the past 10 years2. From census data we can see that younger generations are driving less than older generations.3
While there is reason to celebrate these trends, the pace at which people are reducing their driving is far too slow to reach our goals.
How I travel vs. how I want to travel
A snapshot in time: our starting point for travel trends in Minneapolis
People are driving less
In the last decade the average number of miles driven per person each day has decreased by about three miles.
Average daily vehicle miles traveled per person in Minneapolis
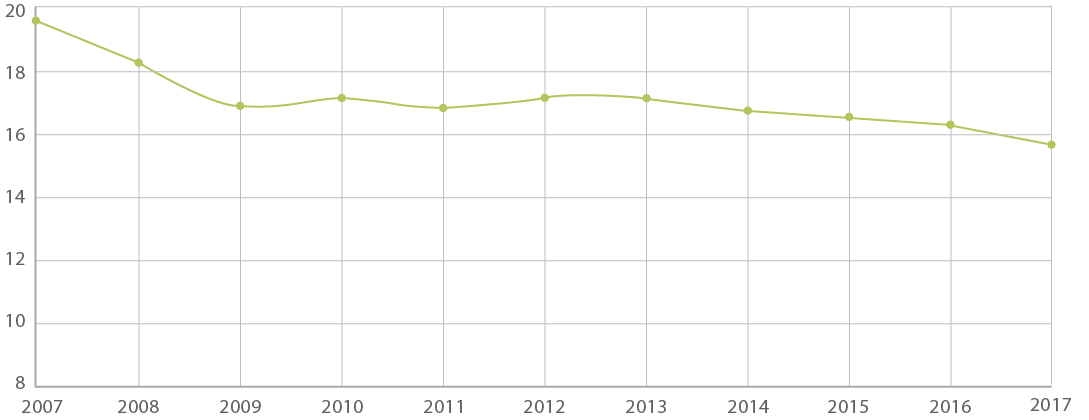
Source: Minnesota Department of Transportation Traffic Data Reports, 2007-2017
Click image to view larger
Despite a rise in population, total vehicle miles traveled has stayed relatively constant.
Between 2010 and 2018 Minneapolis saw an increase of over 35,000 people.4 Despite this growth in population, the total amount of vehicle miles traveled remains fairly constant.5
Average daily vehicle miles traveled
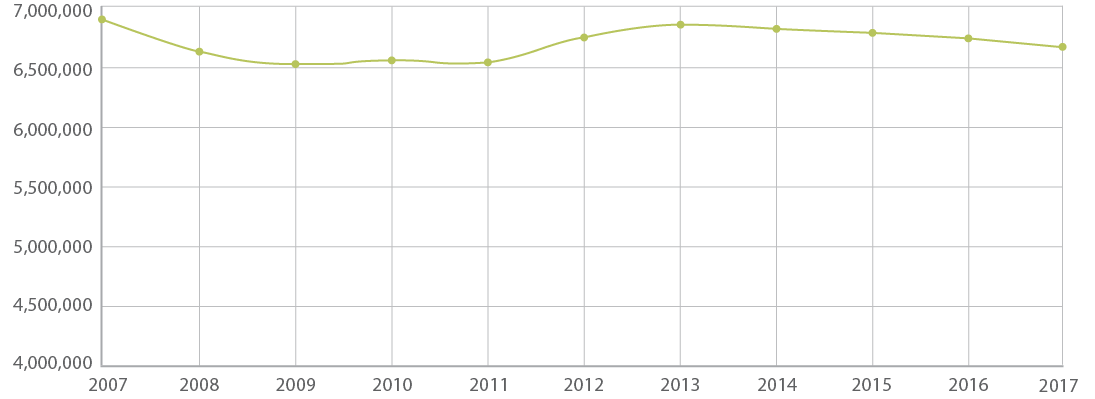
Source: Minnesota Department of Transportation Traffic Data Reports, 2007-2017
Click image to view larger
People are more likely to walk, bike or take transit for shorter trips
The Metropolitan Council maintains a regional travel demand model. According to the model, for trips less than one mile people choose to walk 46% of the time and drive 16% of the time.6
Minneapolis trips beginning and/or ending in Minneapolis
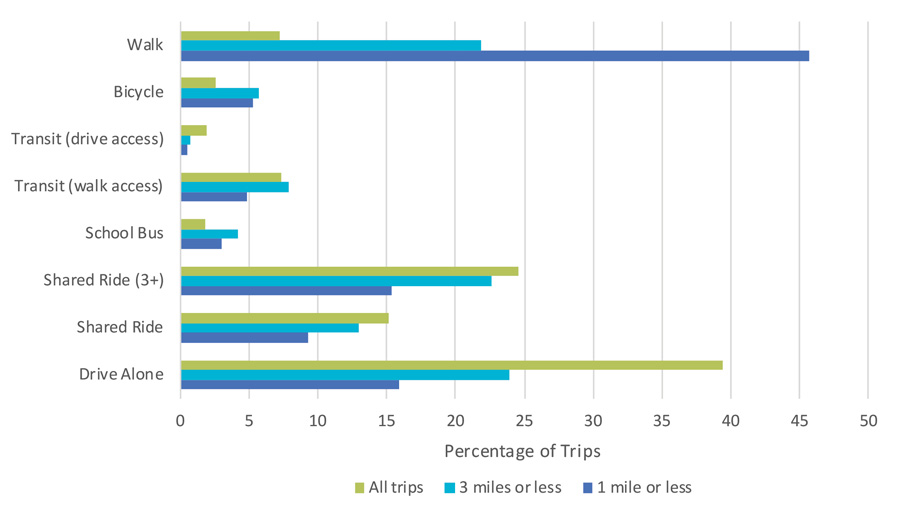
Source: Metropolitan Council Regional Travel Demand Model, 2015 Base Scenario
Click image to view larger
People are walking and biking more
The City has been collecting information about the number of people walking and biking at 30 benchmark locations since 2007. While the mode share for bicycling and walking stayed relatively constant over this period7, these counts show that the number of people walking and biking in Minneapolis has steadily risen over this period.
People walking vs. biking
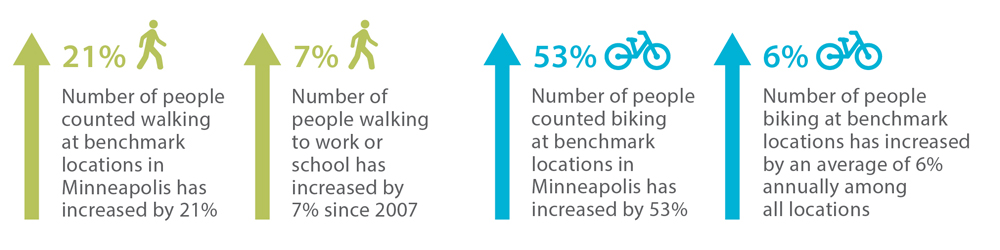
Source: Walking and Biking in Numbers
Click image to view larger
Commute to work changes by age
According to the U.S. Census clear trends are seen connecting age and commute to work preferences. Younger workers more likely to travel to work by means other than driving alone. The likelihood of walking, taking a taxi, motorcycle, bicycle or other means, using public transit, or carpooling all decline with age, while the likelihood of working at home or driving alone to work all increase with age.8
Commute travel mode by age, Minneapolis residents
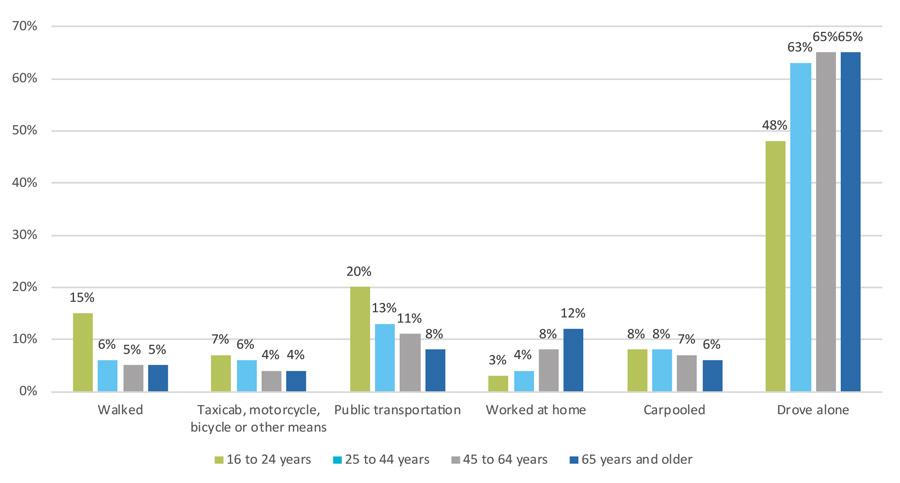
Source: 2018 American Community Survey 5-year estimates
Click image to view larger
Overall commute mode share has remained fairly constant
Between 2010 and 2018 the commute mode share to work stayed relatively constant.9 While there was a slight decline in driving alone to work (-1.3%) and carpooling to work (-0.2%), there hasn't been a substantial shift in the way people get around.
Driving to work alone vs. carpooling to work
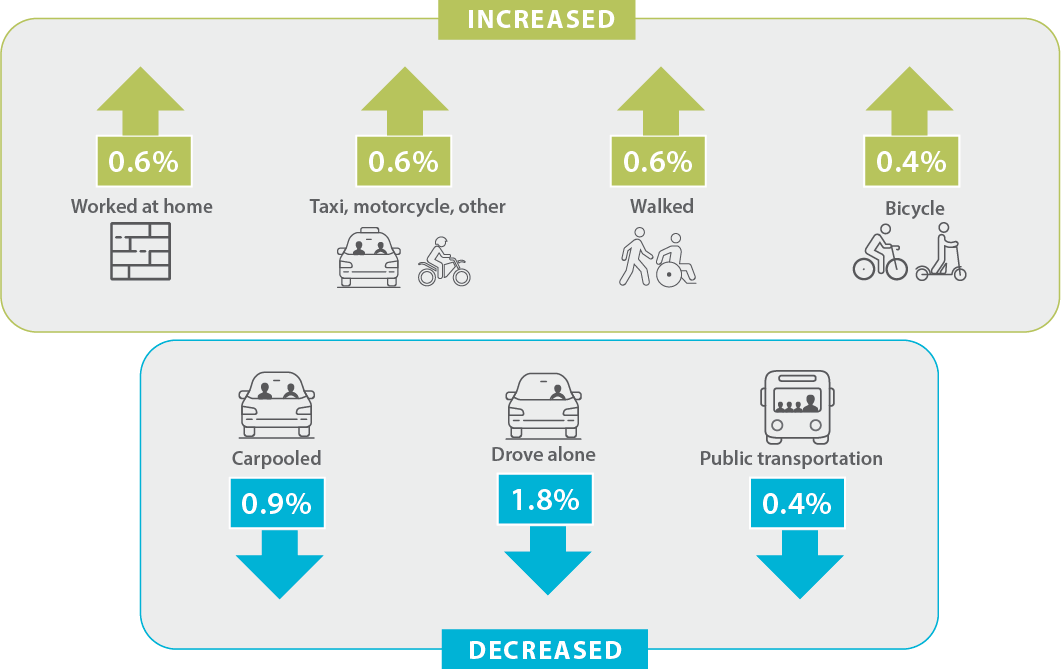
Source: 2010 and 2018 American Community Survey 5-Year Estimates
Click image to view larger
Next, learn about Minneapolis streets in 2030
- Between 2008 and 2018 the annual VMT in Minneapolis decreased from 2.44 billion miles to 2.37 billion miles. In the same time, the annual VMT per capita decreased from 7,189 miles to 5,567 miles. Source: Minnesota Department of Transportation Traffic Data Reports. During this time frame population increased from about 384,000 to over 425,000.
- Walking and Biking in Numbers
- Means of Transportation to Work by Select Characteristics, U.S. Census Bureau, 2018 American Community Survey 5-Year Estimates
- Demographic and Housing Estimates, U.S. Census Bureau, 2010 and 2018 American Community Survey 1-Year Estimates
- Minnesota Department of Transportation, Roadway Data, VMT by Route System in each City within each County (2001-2014, 2016-2018)
- Metropolitan Council Regional Travel Demand Model, 2015 Scenario
- 2010 and 2018 and American Community Survey 5-Year Estimates
- Means of Transportation to Work by Age, U.S. Census Bureau, 2018 American Community Survey 5-Year Estimates
- American Community Survey 1-Year Estimates