Making & Monitoring Progress
Making progress: the implementation framework
The pace of progress: implementation strategies
The strategies and actions in this plan vary in complexity and scale. Some represent tangible projects that will be planned, funded, scoped, designed, constructed and exist out in the world – these are easier to plan and schedule. Others are about changing how we approach the work – the rationale for how decisions are made or which projects move forward. Given the various scale and complexity, including those that require contribution and collaboration with partner agencies, it is difficult to predict with precision when or how the actions will be completed.
Reporting on progress
Staff will report on the success and challenges of achieving the strategies and actions laid out in this plan through two venues: our annual Your City, Your Streets Progress Report and a more formal progress report on the plan every two years.
The Transportation Action Plan identifies strategies and actions for the next 10 years – from 2020 to 2030. But the pace of change in the transportation world – through technology, new ways of getting around, as well as increased attention and focus on the link between transportation choices and climate change – ensures that some focus areas in this plan will evolve over the next ten years. If major adjustments are needed, we will amend the plan to address those needs.
Monitoring progress: tracking indicators demonstrate influence
We have identified five tracking indicators that over time will measure how our efforts influence broader change. The impacts of our transportation plans, projects and investments influence these indicators but are not solely responsible for their success. We know the City’s transportation investments alone will not result in our reaching these goals, but they are important metrics for us to monitor. All the tracking indicators work toward a more inclusive transportation system that has equity at its core – by shifting people into more sustainable and affordable modes, protecting our most vulnerable street users, reducing pollution, connecting people to frequent and reliable transit, and reducing the distance people travel to get to their daily needs. By pursuing the strategies and actions in the TAP we aim to advance the City of Minneapolis’ work on advancing equity and racial equity.1
Mode shift
Today, people driving alone make up 40% of all trips in Minneapolis.2 To meet our goals we have set a mode split goal of reducing that number to 20%. Mode shift goals are for trips that start or end in Minneapolis only.
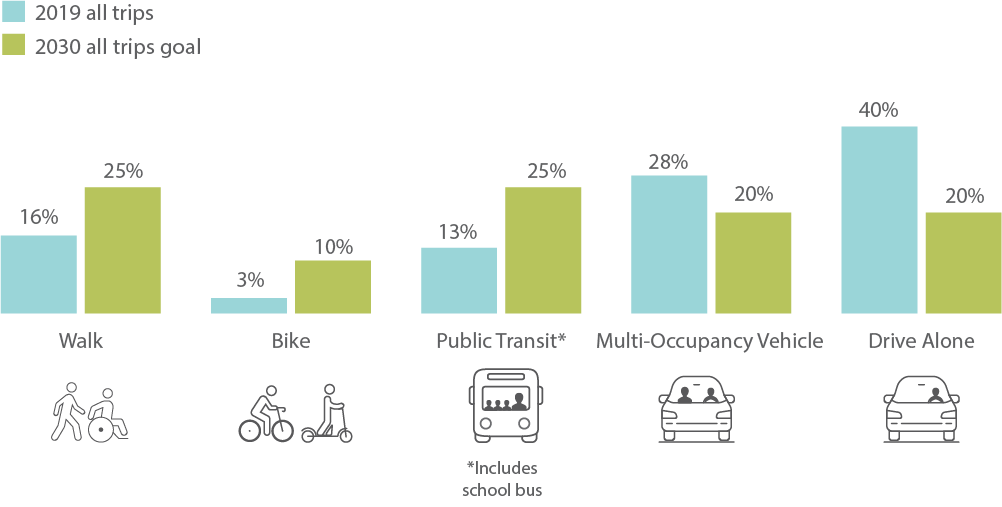
All trips goal:
- 35% walking and biking (25% walking; 10% biking)
- 25% public transit
- 20% multi-occupancy car
- 20% driving alone
2019 Baseline:
- 19% walking and biking (16% walking; 3% biking)
- 13% public transit
- 28% multi-occupancy car
- 40% driving alone
Safety
Goal:
Zero severe and fatal traffic crashes by 2027
2016-2018 average baseline:
13 people killed; 133 people severly injured on average annually3
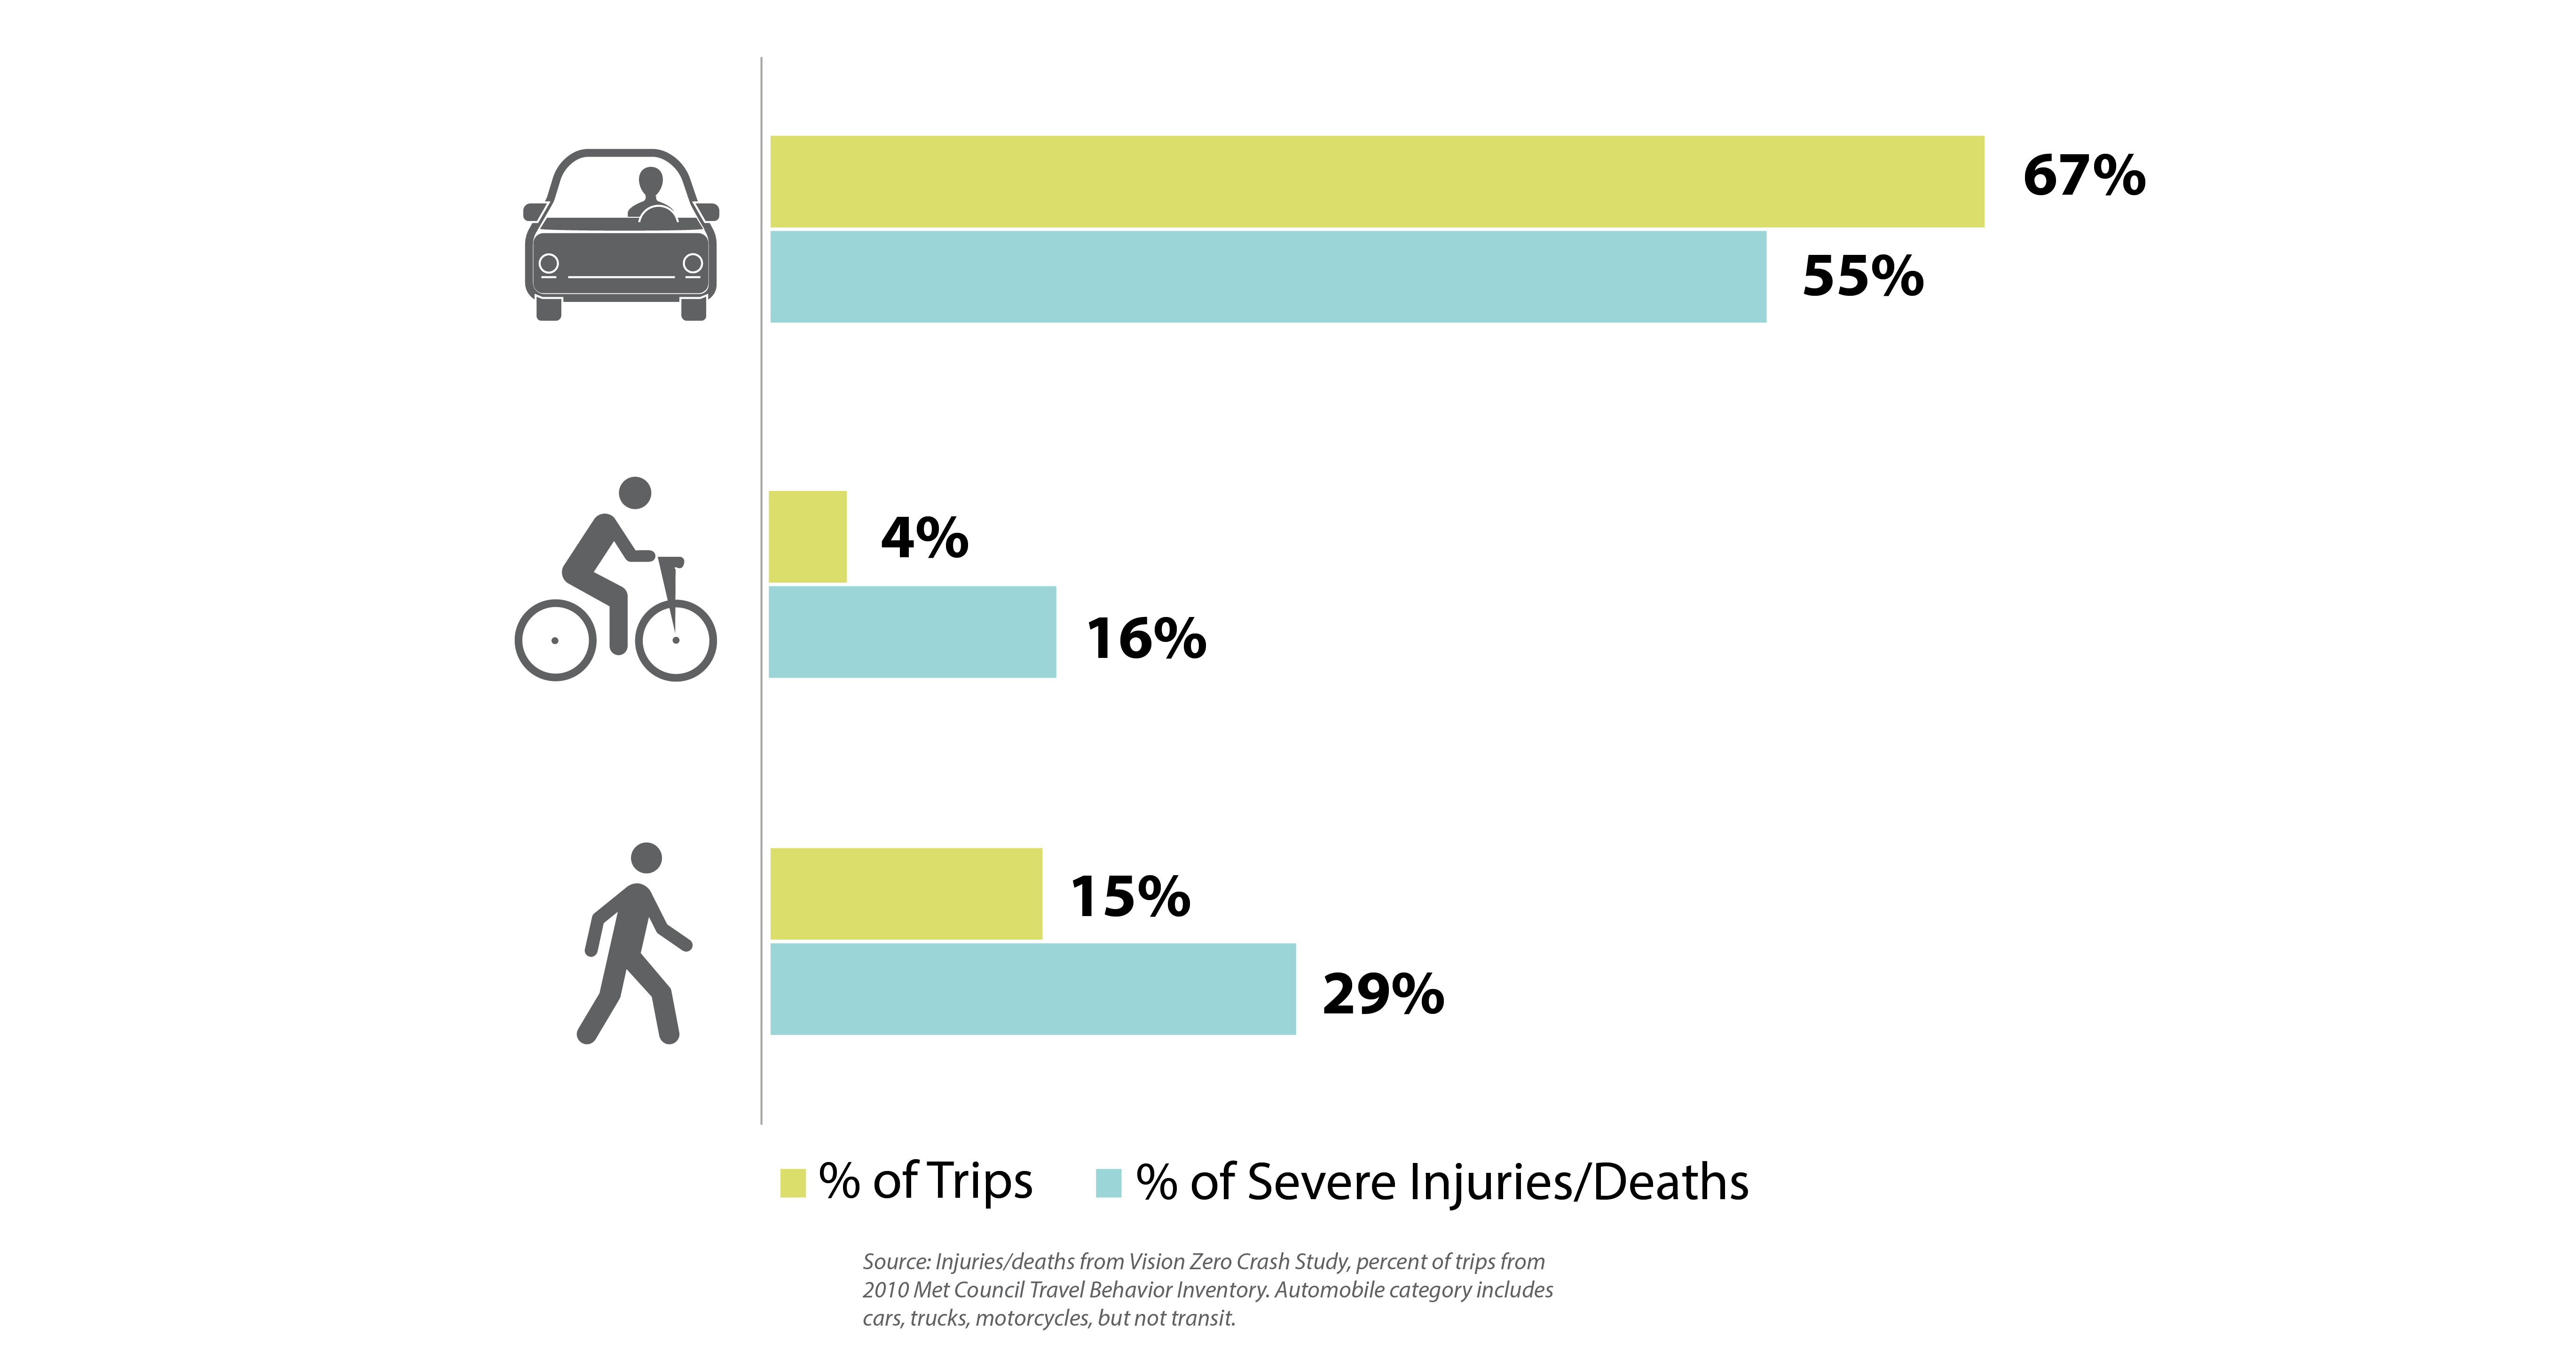
The City committed to Vision Zero in 2017 with the goal of reaching zero traffic related fatalities and life-altering injuries within 10 years.
People walking and on bikes are overrepresented in crashes that result in fatalities or severe injuries
Greenhouse gas emissions from the transportation sector
Goal:
100% reduction by 2050 (from 2006 baseline); or 333,000 metric tons in 2030
2006 baseline:
1,110,152 metric tons
As of 2018, the transportation sector accounted for 24% of greenhouse gas emissions in Minneapolis4. The City has adopted a goal of a 100% reduction (net-zero emissions) by 2050, starting from a 2006 baseline.
Greenhouse gas emissions (metric tons) from transportation sector historically and projected to reach City's adopted net-zero emissions goal.
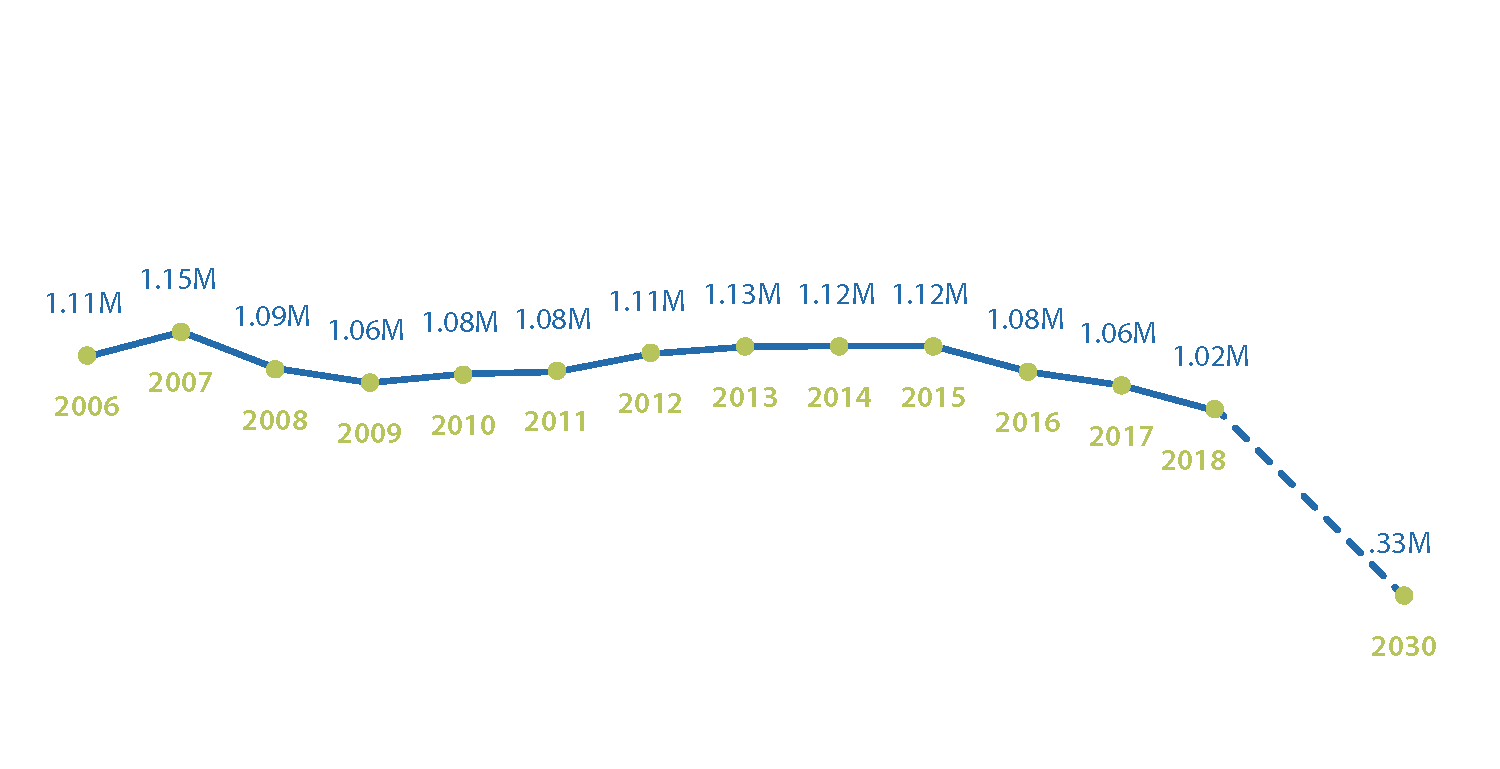
Source: Citywide Greenhouse Gas Emissions Inventory (2018)
Vehicle miles traveled
Goal:
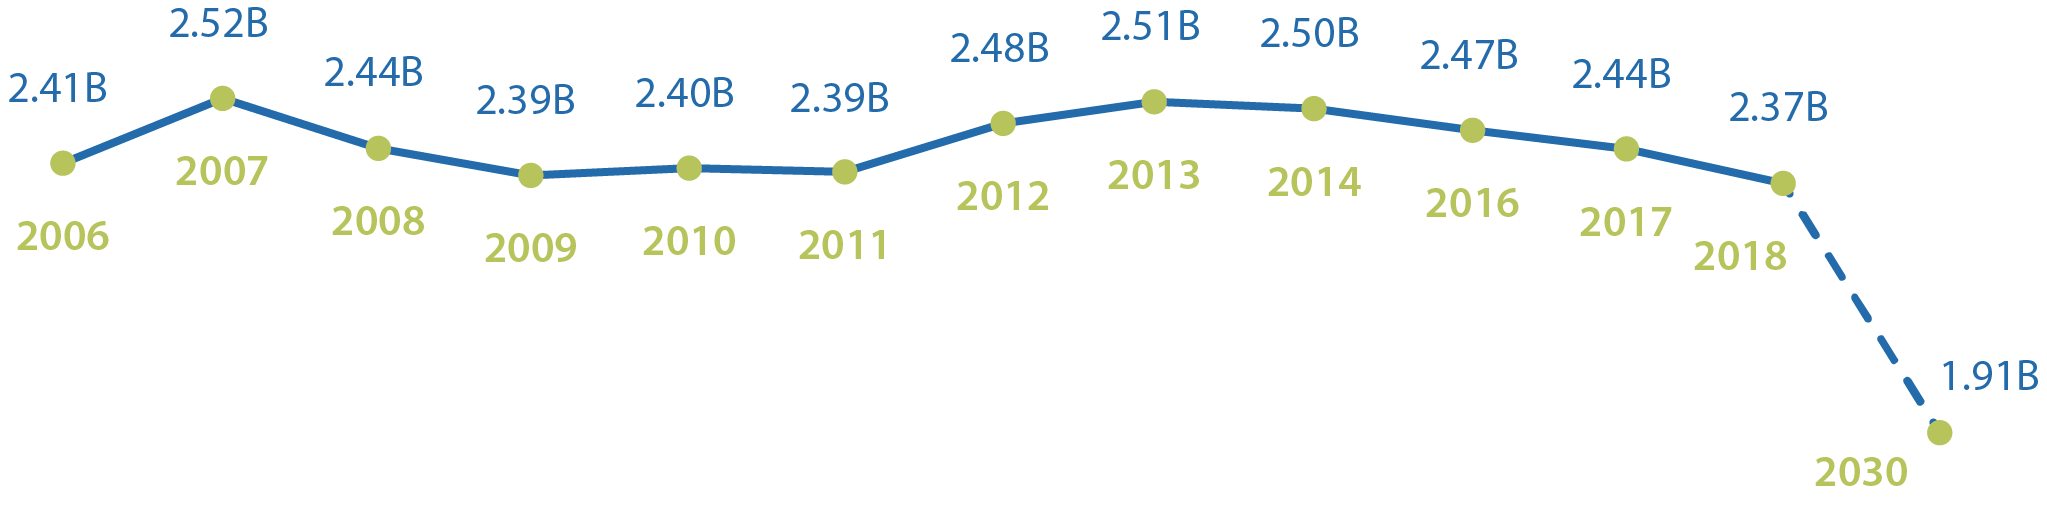
500 million less vehicle miles traveled by 2030 (from 2018 baseline); 1,868,057,420 miles traveled in 2030
2018 baseline:
2,368,057,420
Currently, nearly 2.5 billion miles are driven on Minneapolis streets each year, or simply put, each resident drives 15 miles per day on average.5 For the City to meet its greenhouse gas emissions goal of net-zero emissions by 2050, we need to reduce the average amount of driving per person and increase the share of electric vehicles. To support our 2050 greenhouse gas emissions goal, Minneapolis residents will need to drive four less miles per day on average, reducing their average daily driving to 11 miles per day, by 2030.6
Vehicle miles traveled historically and projected to reach City's goal
Transit proximity
Goal:
75% within ¼ mile (5-minute walk); 90% within ½ mile (10-minute walk)
2018 baseline:
47% within 1/4 mile (5-minute walk) - 68% within 1/2 mile (10-minute walk)
Nearly one-half of people living in Minneapolis are within a five-minute walk of high frequency transit; the goal is to increase this number by over 50% over the next 10 years.
5- and 10-minute current walksheds to high frequency transit, as of 2020
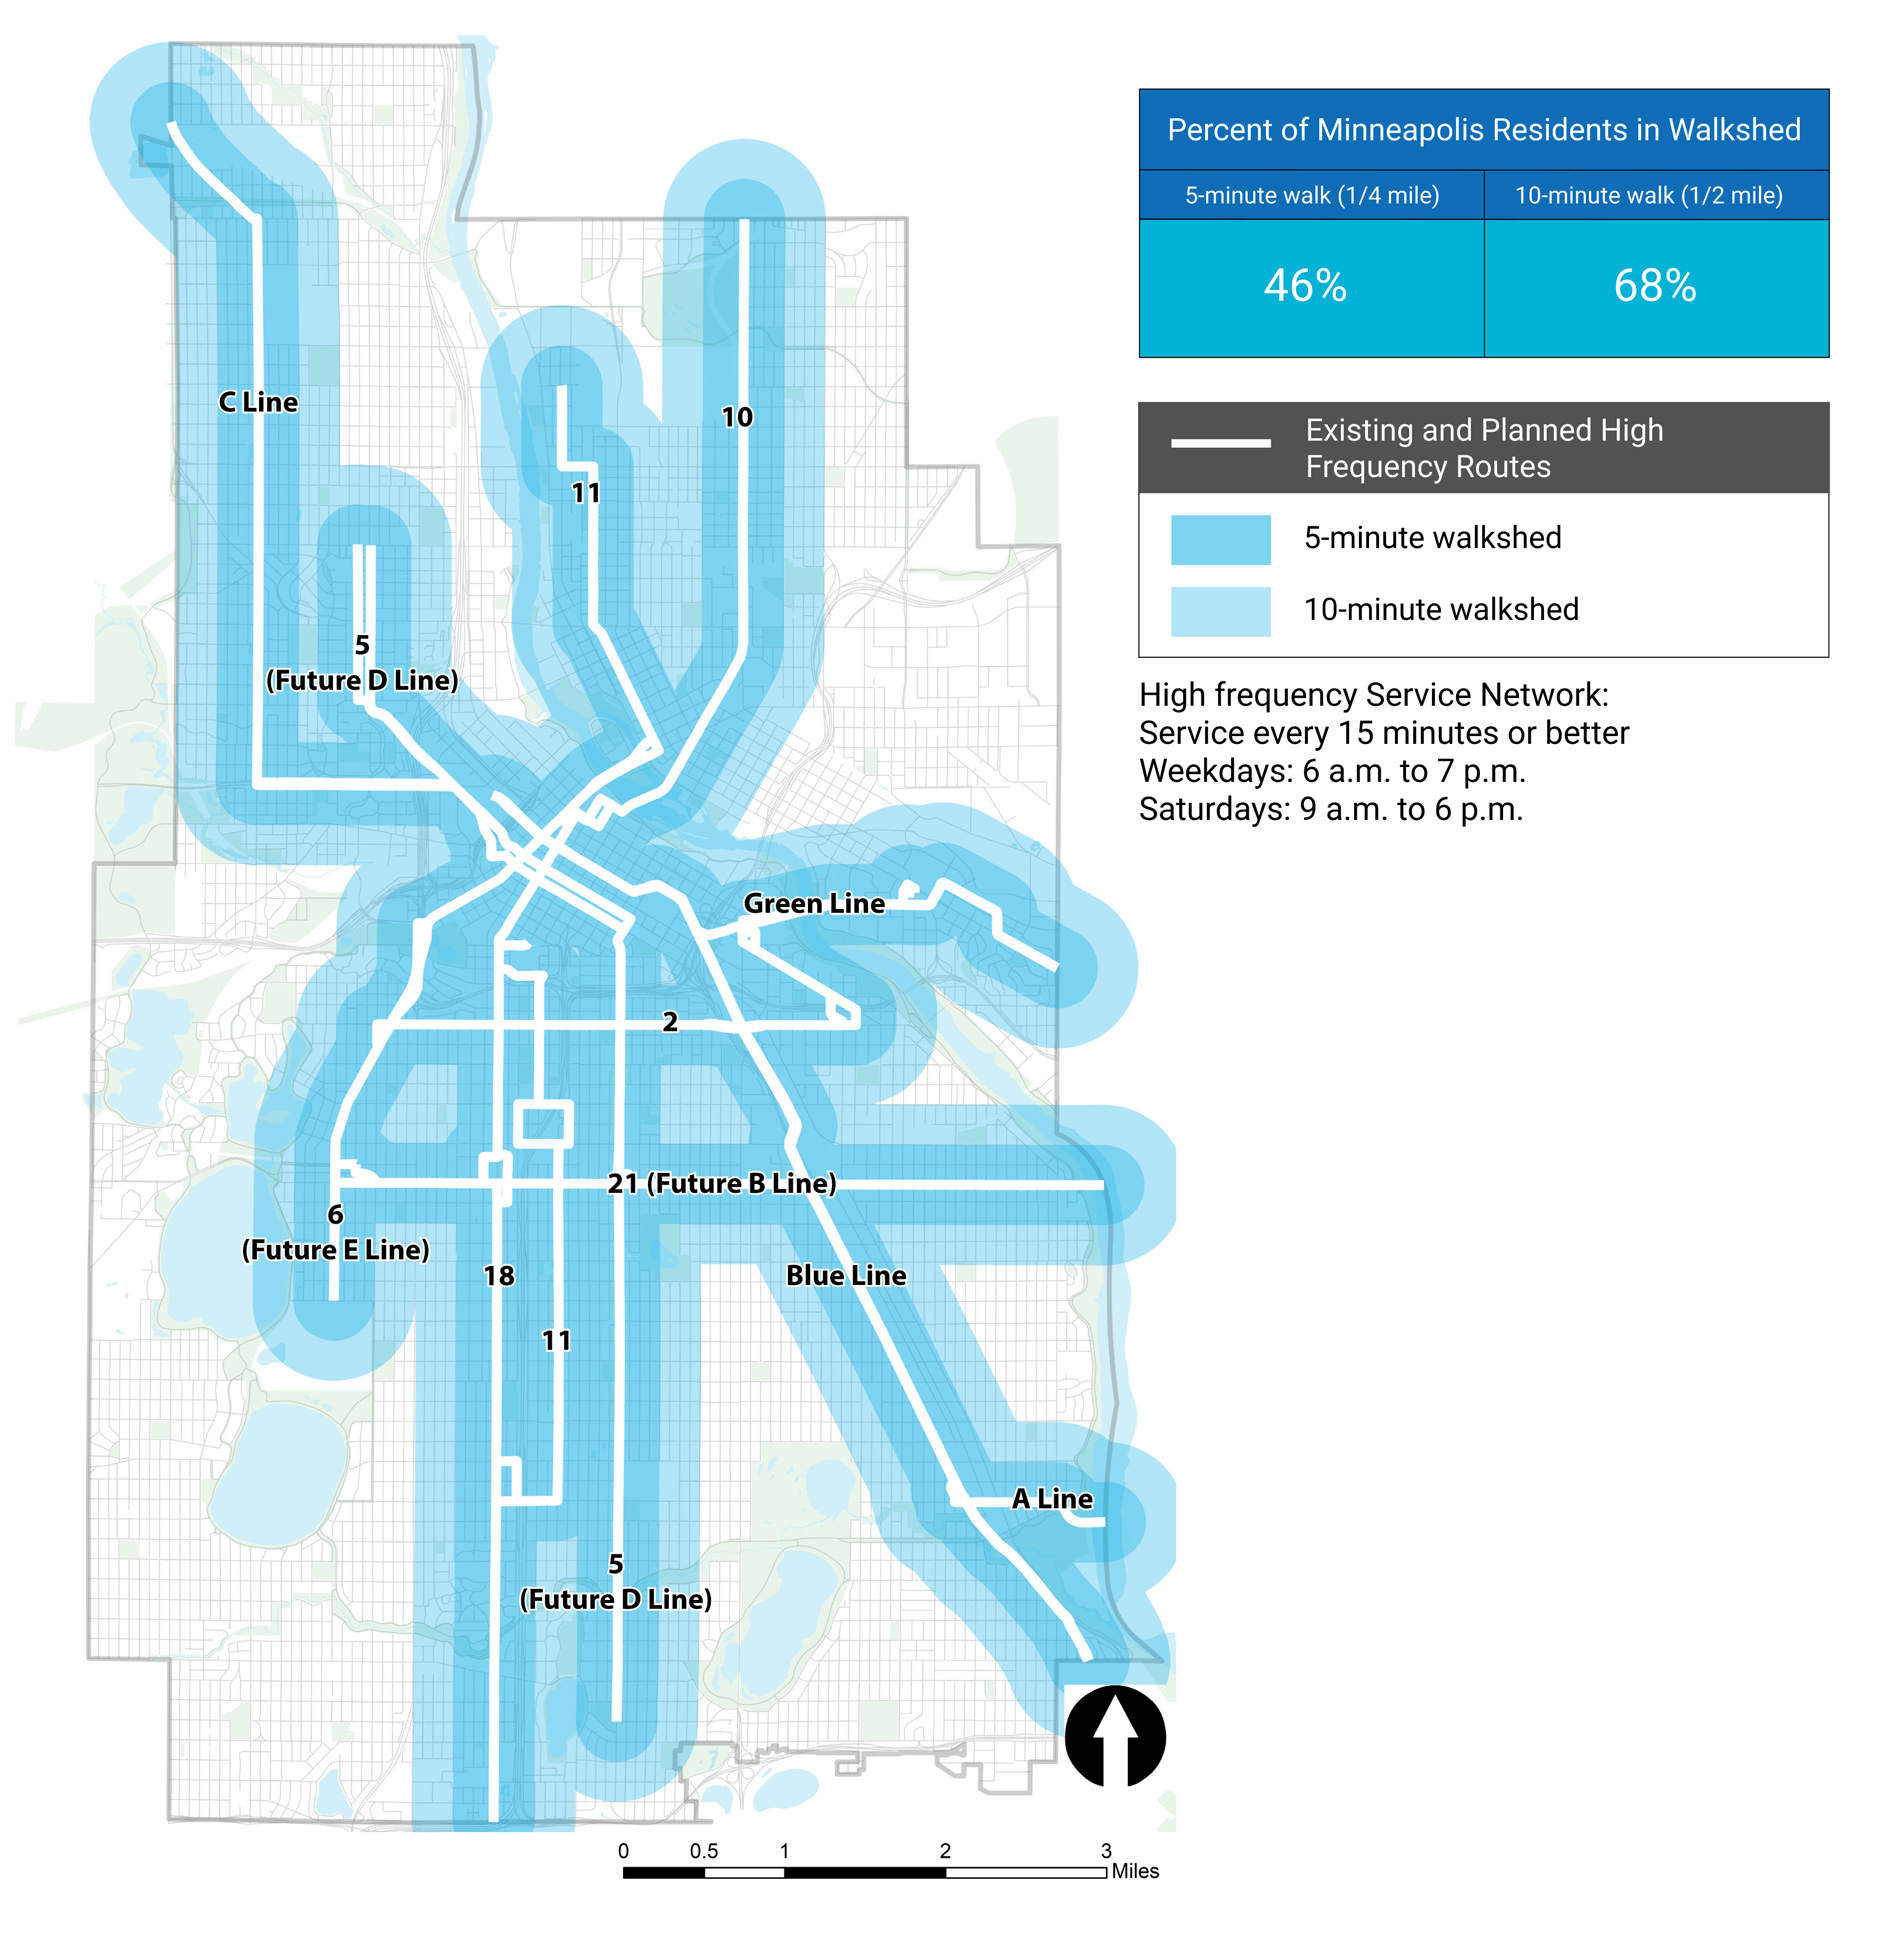
Source: Based on 2018 American Community Survey 5-year estimates
- Minneapolis City Council definitions: Equity is defined as fair and just opportunities and outcomes for all people; racial equity is defined as the development of policies, practices and strategic investments to reverse racial disparity trends, eliminate institutional racism, and ensure that outcomes and opportunities for all people are no longer predictable by race.
- Metropolitan Council’s Travel Behavior Inventory, 2019
- Crashes excluded from this include: 1) crashes on freeways; 2) crashes on private property; 3) Crashes reported as a suicide or a homicide in which the ‘party at fault’ intentionally inflicted serious bodily harm that causes the victim’s death; and 4) crashes caused directly and exclusively by a medical condition.
- Citywide Greenhouse Gas Emissions Inventory (2018)
- Minnesota Department of Transportation and US Census, American Community Survey. Minnesota Department of Transportation vehicle miles traveled data is a collection of all vehicle miles traveled in the City of Minneapolis and does not solely represent vehicle miles traveled for Minneapolis residents. Current population and projected population estimates include all MInneapolis residents regardless of age and were used to calculate daily average mileage.
- Actual daily vehicle miles traveled reduction per person is 4.1 miles, assuming 2030 population forecasts.