MINNEAPOLIS STREETS 2030
Minneapolis Streets 2030
In 2030 our streets will reflect our City values. Our streets will be designed to address a climate emergency by emphasizing low- or no-carbon travel. Our streets will add protection for people walking and bicycling and will be designed to prioritize an effective transit system that serves all trips. Our streets will be organized to enhance access to jobs. Though our streets will continue to serve car traffic, our future depends on our ability to increase the city’s population as projected in Minneapolis 2040 without the car traffic associated with growth. This plan does not eliminate places for people to drive, it simply rebalances space to incentivize and allow for low carbon transportation options.
To that end, there are three major metrics that we can monitor that reflect reaching our goals: mode shift, greenhouse gas reduction, and reduction in vehicle miles traveled, which emphasize the TAP’s focus on climate and equity.
Shifting modes by 2030
Mode split measures the percentage of travelers using a particular type of transportation (walk, bike, transit, car) for a particular trip (work, school, errands). Mode split data is collected from the Metropolitan Council through the Travel Behavior Inventory, which has been collected every 10 years but will be collected more frequently moving forward. This dataset accounts for all trips taken by all people in a household.
Reflecting a reduction of car trips and an increase of walking, biking and transit trips is important to frame the strategies and actions of this plan, which is expressed as shifting modes.
All trips starting and ending in Minneapolis; mode split (2010) and mode split goal (2030)
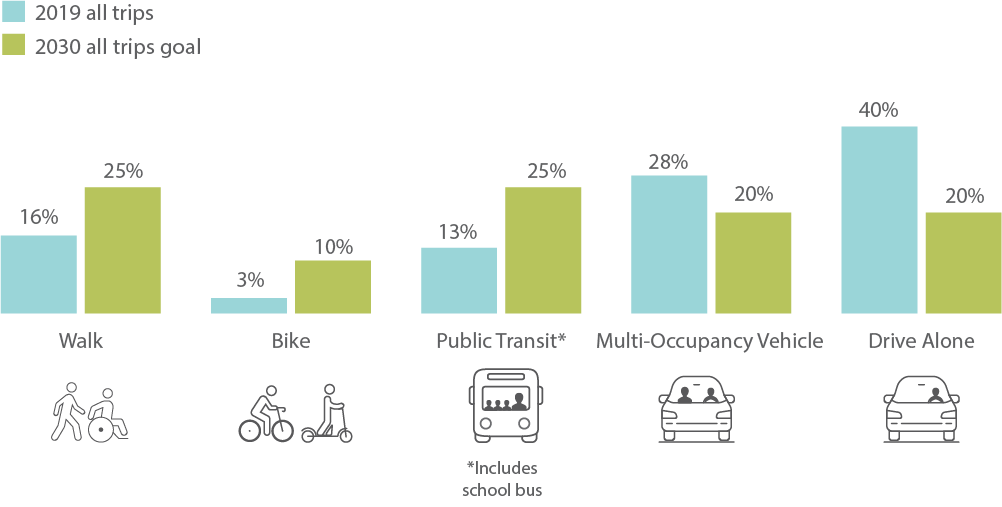
Source: Metropolitan Council, Travel Behavior Inventory, 2019.
There are six key reasons to set a 2030 mode shift goal:


We’ve set a goal of having 60% of trips taken by means other than a car – 35% by walking and biking and 25% by transit.
1
Reduce greenhouse gas emissions and improve air quality
2
Allocate space across all modes equitably
3
Improve quality of life related to trip time and congestion
4
Reduce crash impacts from large vehicles
5
Capture new trips from new residents in ways other than cars
6
Reduce costs for more residents through improved access to lower cost transportation options
2019 data shows that 68% of all trips that start or end in Minneapolis are taken by car – either individually (40%) or with other people (28%). Walking, biking, transit and school bus trips account for just under a third of all trips (32%).1
Greenhouse gas reduction
The environmental impacts of gas-powered vehicles continue to degrade the air we breathe and have negative impacts on health, environment and quality of life. The Minneapolis Climate Equity Plan set a goal of 100% reduction (net-zero emissions) of greenhouse gas emissions by 2050, from 2006 baseline levels. 2006 baseline was just under 5.2 million metric tons citywide from all sources; the goal is carbon neutrality in 2050. Climate trends will likely require the City to take an even more aggressive stance on carbon emissions during the next 10 years, and we have updated this plan to reflect current goals on carbon neutrality.
As of 2018, emissions from on-road transportation account for approximately 24% of greenhouse gas emissions in Minneapolis.3
Vehicle miles traveled reduction
Measuring the total number of vehicle miles driven is important to measuring mode shift and greenhouse gas reductions.
In line with goals set in the Climate Action Plan and reinforced in Minneapolis 2040, we’ve set a goal of reducing vehicle miles traveled by 1.8% per year.4 To reach this goal, the average person in Minneapolis would have to travel just four miles per day less in a car by 2030.5
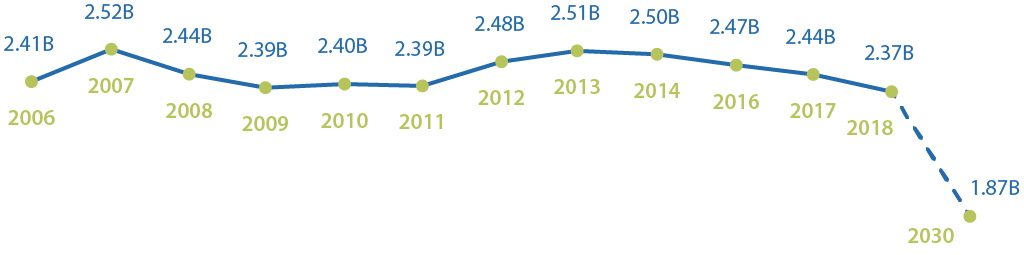
Greenhouse gas emissions (metric tons) from transportation sector historically and projected to reach City's adopted net-zero emissions goal.
Source: Citywide Greenhouse Gas Emissions Inventory
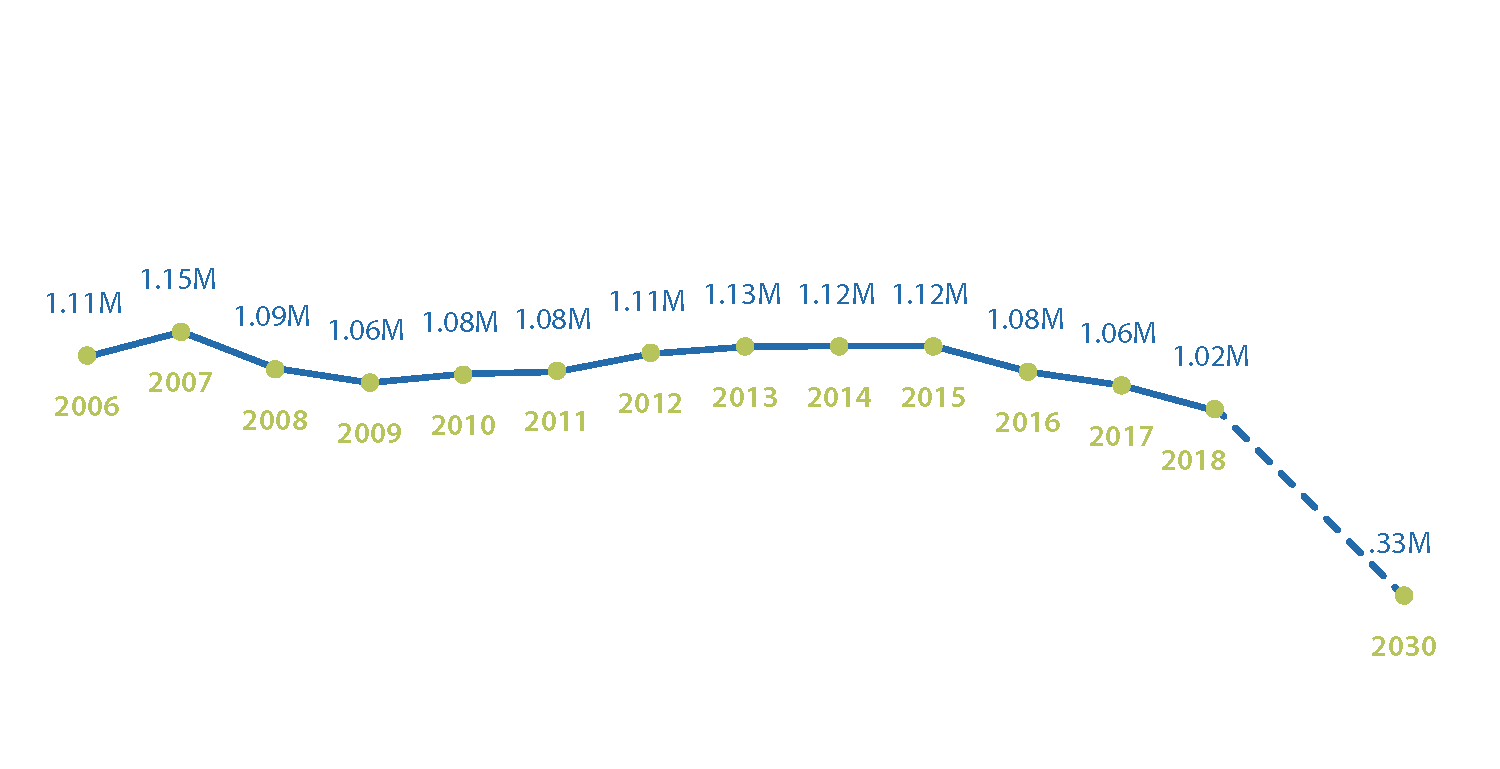
Vehicle miles traveled historically and projected to reach City's goal
Anticipated progress on upcoming corridors
Certain streets in Minneapolis will be reconstructed within the next 10 years – the timeframe of the TAP – and their street designs will be influenced by the strategies and actions identified in this plan.
Upcoming capital projects will be influenced by the Street Design Guide, which will reference the priority networks defined in this plan: the Pedestrian Priority Network, the All Ages and Abilities Network (for biking and micromobility), Transit Priority Projects, and the Truck Route Network. When the Pedestrian Priority Network, the All Ages and Ability Network, and streets with transit overlap on the same street segment, the design decisions are often most difficult, especially when the public right of way is most constrained. These corridors, while challenging, provide the greatest opportunity to make bold changes to advance mode shift goals, greenhouse gas reductions and reductions in vehicle miles traveled. The Street Design Guide will provide guidance on how all of these modes can come together to support our Complete Streets Policy.
While subject to change, the streets shown in the Opprotunity Corridors map are currently recommended for street reconstruction sometime within the next 10 years and have overlapping priority networks.
Upcoming street reconstruction/overlapping priority networks as of 2020
The corridors on this map have three or more overlapping networks from the Transportation Action Plan. These include the All Ages and Abilities Bicycle Network, the Pedestrian Priority Network, the Freight Route Network and the Transit Network.
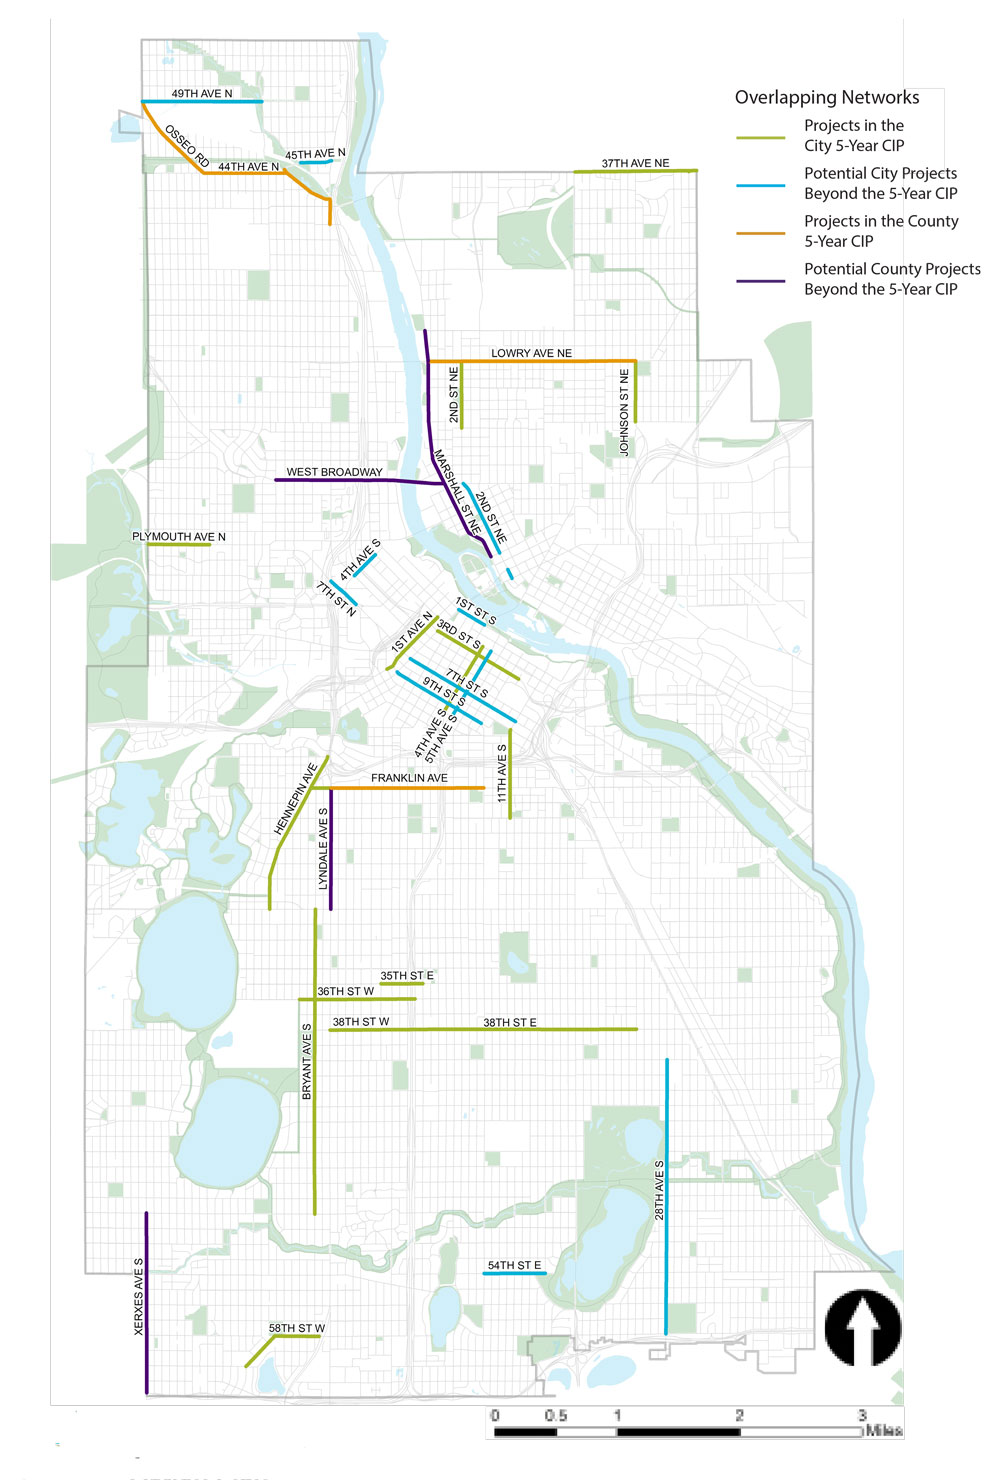
Click image to view larger
Quick results
Key quick-build projects identified in our strategies and actions are highlighted below. These are tactical projects that greatly and quickly increase access and mobility, but do not require an entire street to be reconstructed. Examples include reconfiguring streets to provide transit advantages, building out a network of mobility hubs, and making operational changes to streets downtown to encourage mode shift and promote safety.
Transit priority lanes
Transit priority lanes, often realized as bus-only lanes, provide dedicated space for people traveling by bus or other transit vehicles, unobstructed from other traffic. By dedicating space on our streets for transit, we are improving the speed and reliability of travel which encourages more people to take transit. Collectively, this lightens our carbon footprint and lessens the demand for parking at destinations, which helps free up more space for active uses of our shared public space – an example of a virtuous circle created by giving residents options. We have piloted bus-only lanes on Hennepin Avenue S, Chicago Avenue and Nicollet Avenue; these early pilots have shown that improvements can be realized in speed and reliability for those on transit. These actions are outlined in Transit Action 2.1; Transit Action 2.2 illustrates other potential opportunities to install transit only lanes.
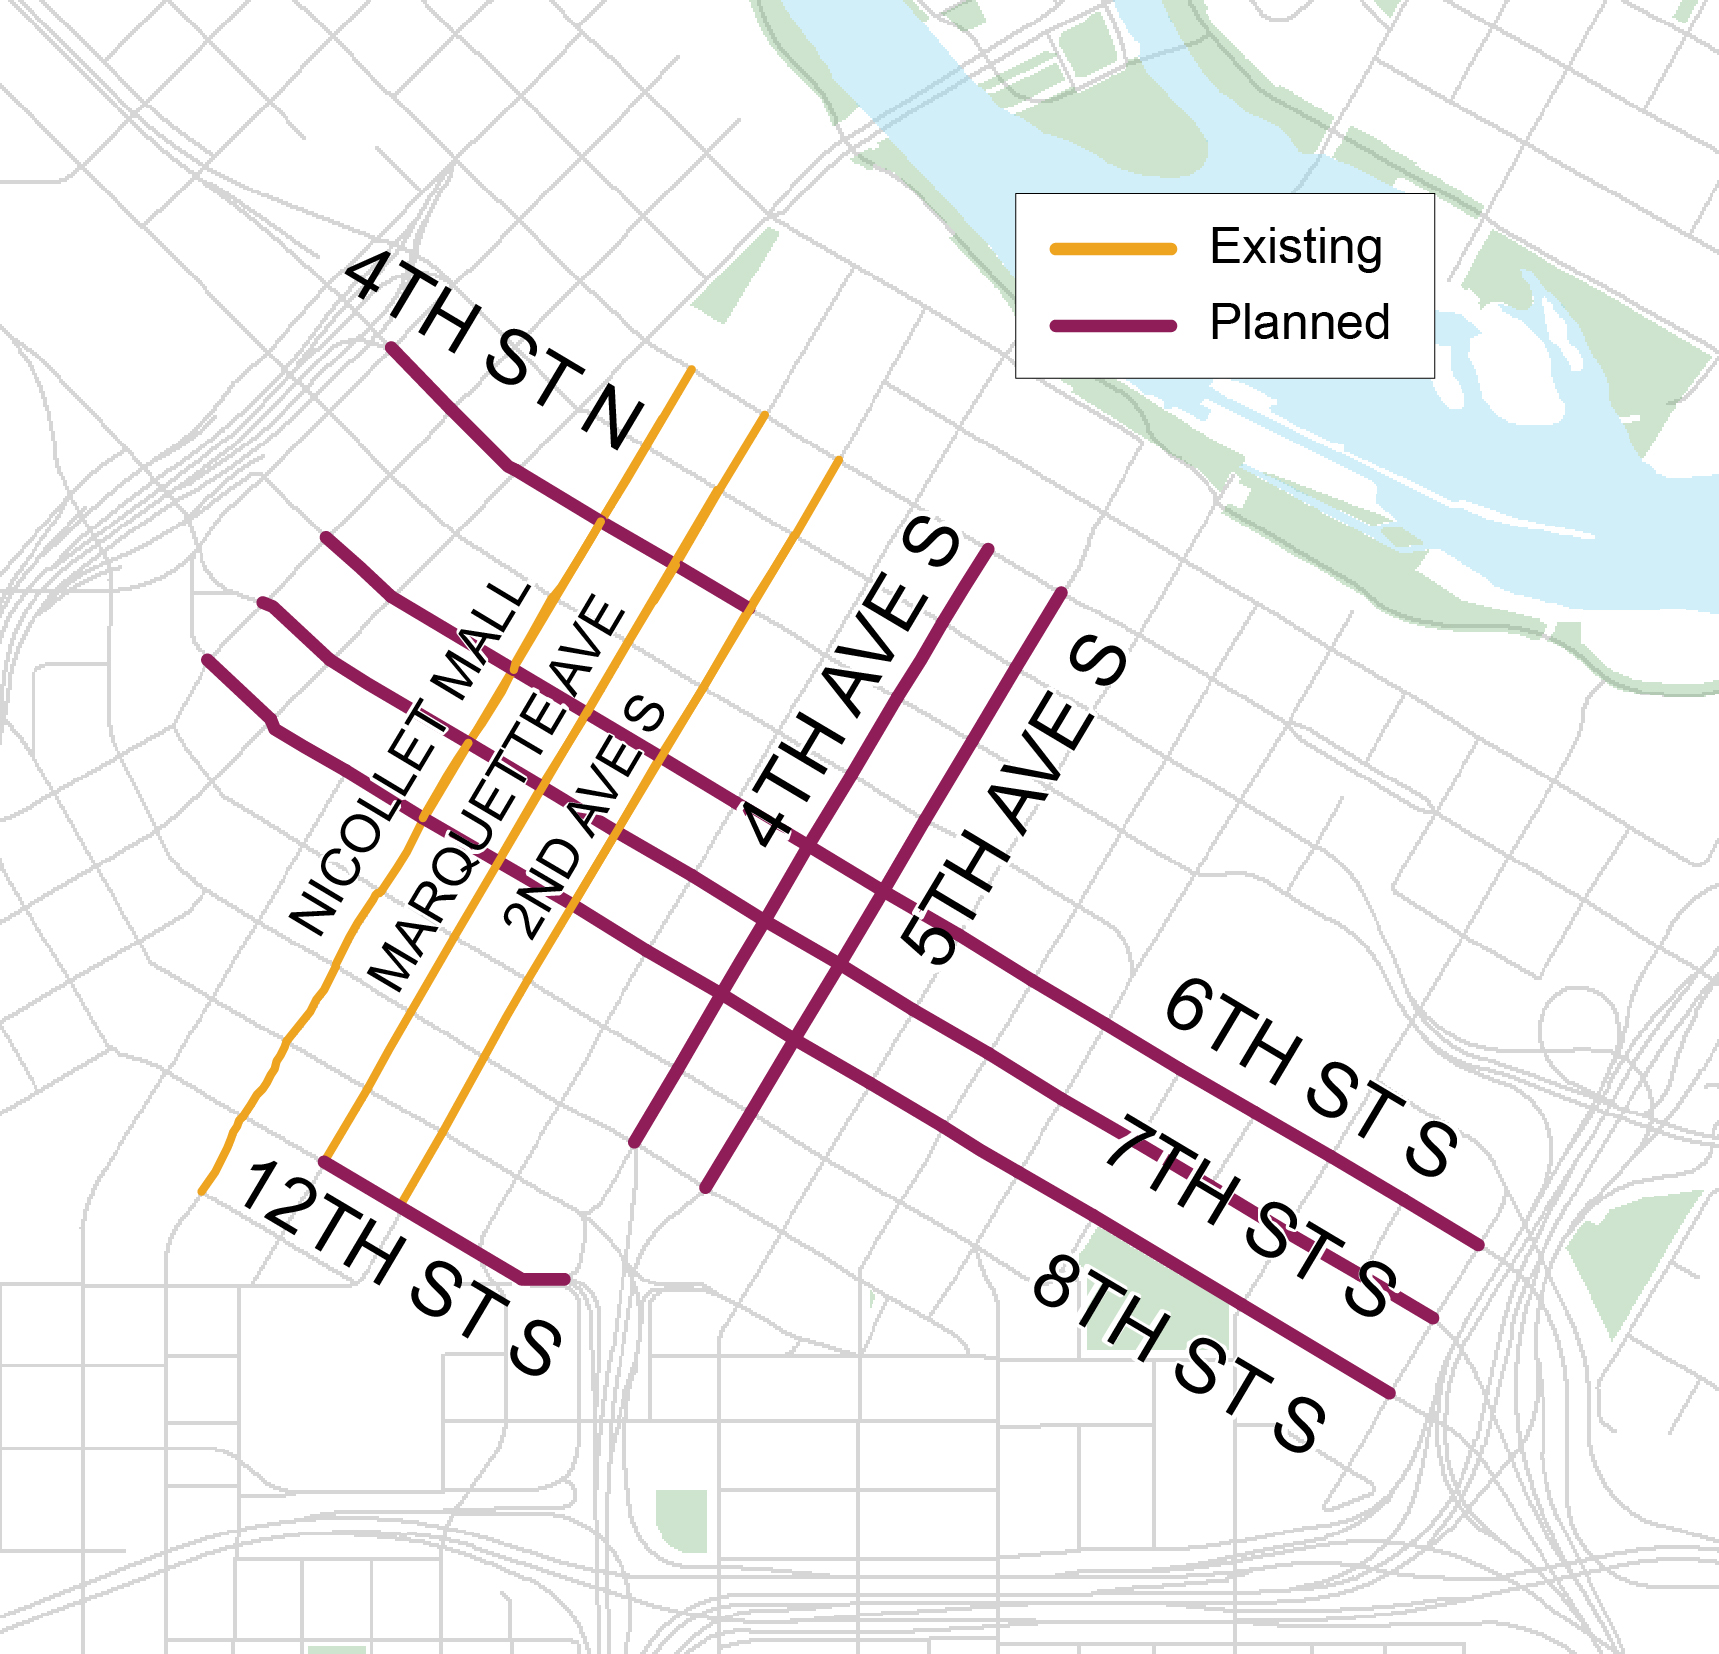
Streets where we plan to allocate space for bus-only lanes include:
- 4th Avenue South between Washington Avenue and 10th Street South
- 5th Avenue South between Washington Avenue and 10th Street South
- 6th Street North/South between 1st Avenue North and 13th Avenue South
- 7th Street North/South between 1st Avenue North and 13th Ave South
- 8th Street North/South between 1st Avenue North and 13th Ave South
- 4th Street North/South from the west/freeway connections to the Marquette/2nd Avenue transit facilities
- 12th Street South between I-35W and Marquette Avenue South
Mobility hubs
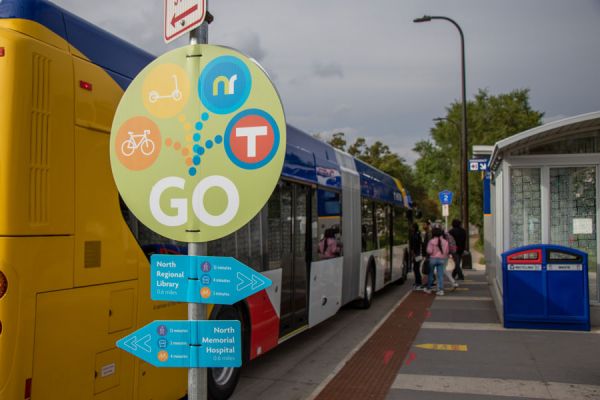
The City has begun to pilot mobility hubs in neighborhoods throughout the city – which locate several low carbon, shared transportation services or options at the same location. This allows people to make more seamless connections between bus, bikeshare, scooters, and/or carshare and helps to ensure transit trips have a more significant reach by coordinating viable options to complete the last leg of a trip. They also serve as gathering spots anchored in transportation that provide a sense of place and opportunity for people to enjoy the street.

Twelve pilot mobility hubs in Minneapolis were installed in 2019; these are providing early lessons on how to build out a network. Over the next couple of years, people should expect to see a network of mobility hubs developed throughout the city. These actions are outlined in Technology Action 3.1.
Mobility hub pilot
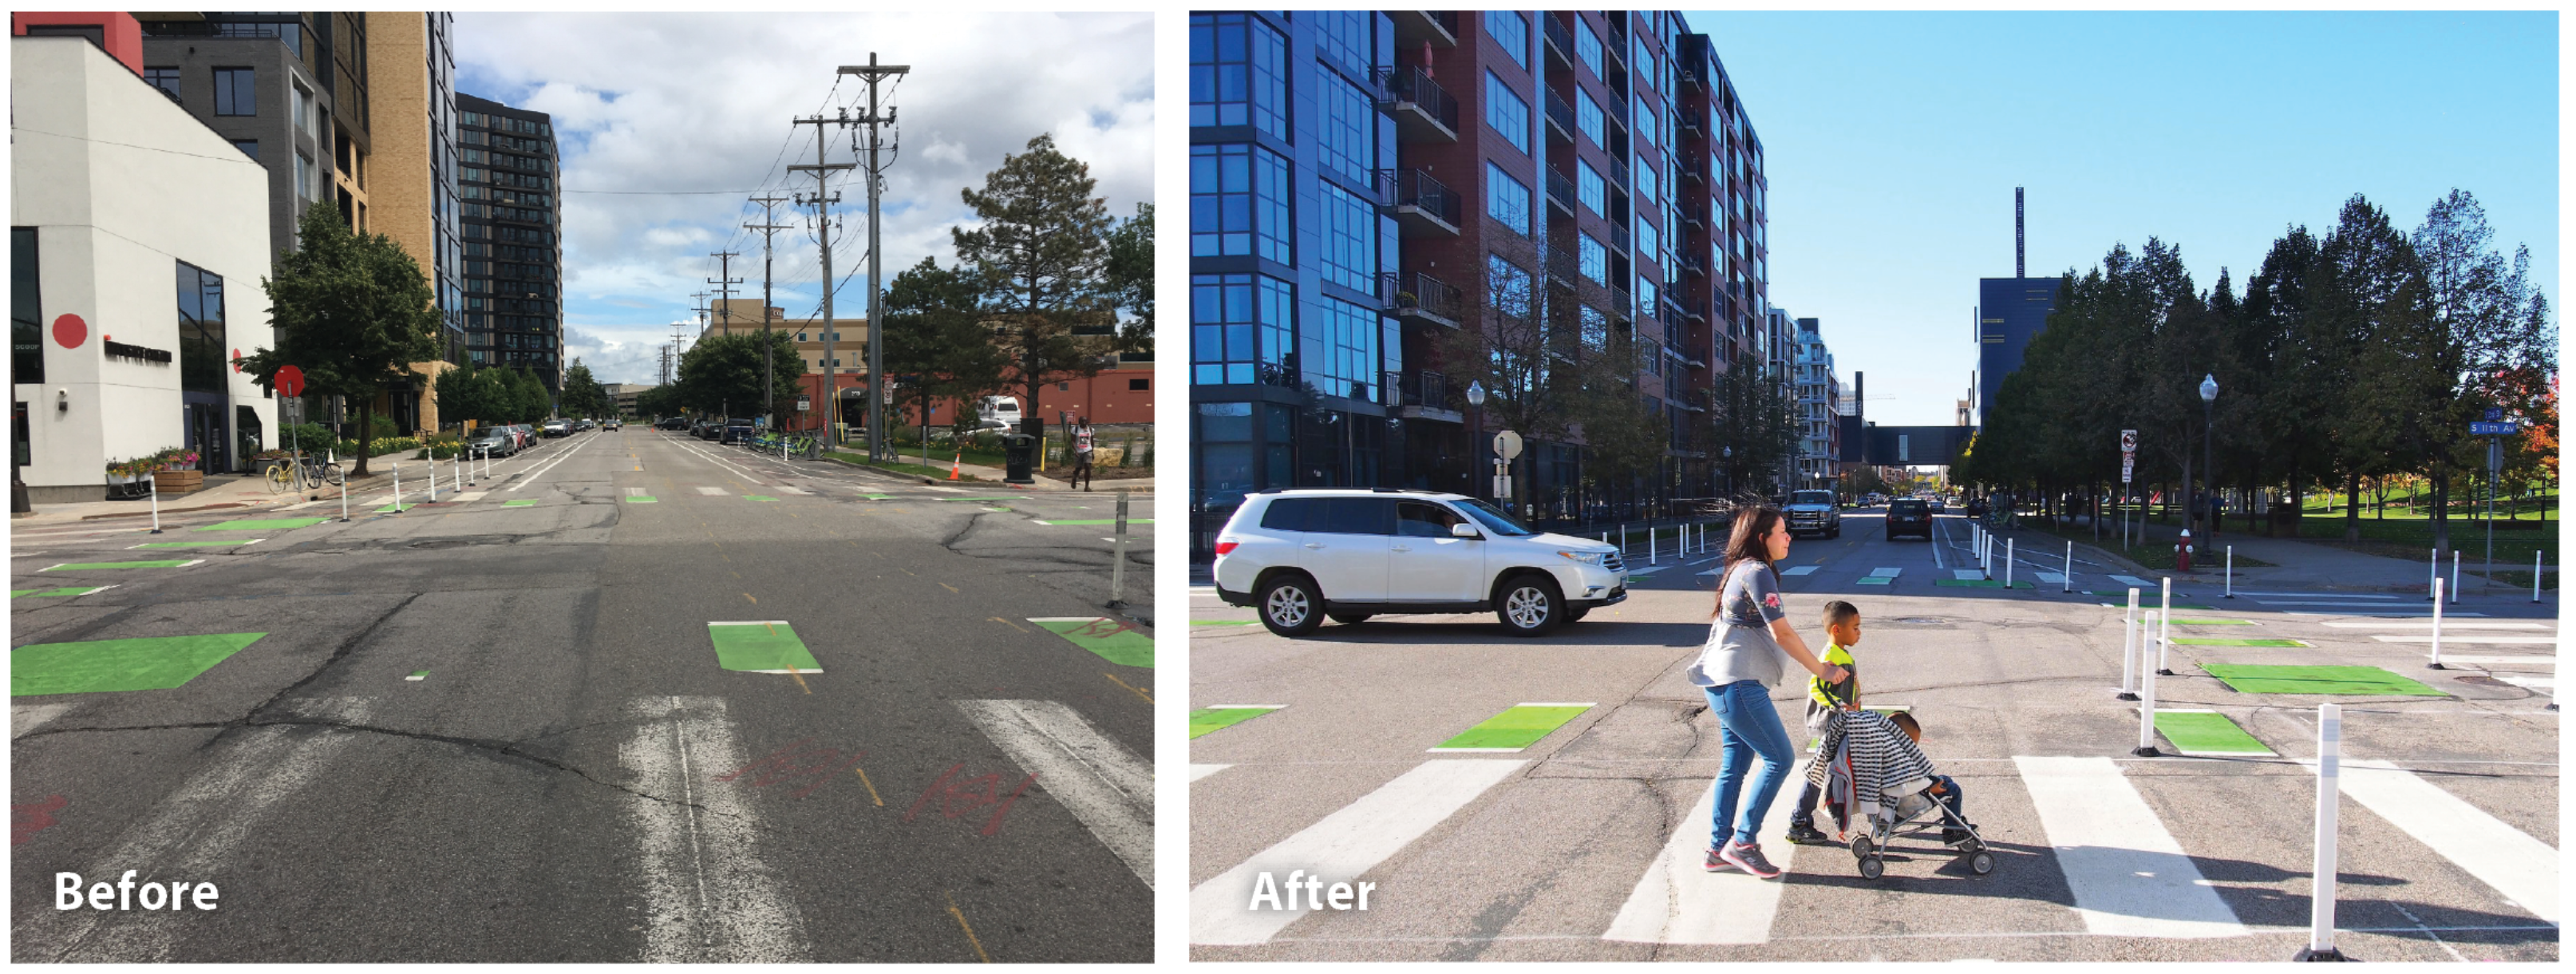
Paint and bollards improve conditions for people walking and bicycling; 11th Avenue and 2nd Street S
Downtown Minneapolis bus-only lanes as of 2020
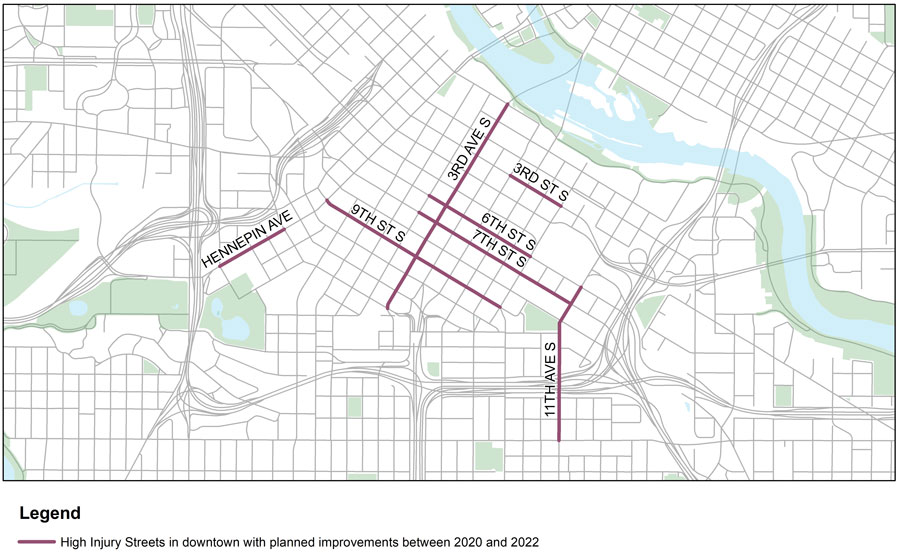
High Injury Streets in downtown as of 2020
A focus on downtown operational changes to move people
Over 205,000 people work downtown.6 Streets downtown play a huge role in the regional economy and how people decide to travel to work. The speed of transit, the safety of bike lanes, and the space and comfort of the sidewalk all influence how people decide to travel to, from and through downtown. By focusing on operational changes to our street network – without waiting for a large capital project – we can open travel options in the densest area of the city where we can make the most impact most quickly.
Near term operational changes will largely be realized by making safety improvements to High Injury Streets identified in our Vision Zero efforts. These streets are identified because they have not had recent safety improvements and are not planned for near-term reconstruction. Near-term safety improvements on these streets will be done with changes in paint, additional bollards, or potential signal changes as outlined in the Vision Zero Action Plan.
High Injury Streets downtown that we plan to make improvements to between 2020 and 2022 include:
- 3rd Avenue South between 1st Street and 12th Street
- 11th Avenue South between 6th Street and Franklin Avenue
- 9th Street between Hennepin Avenue and Chicago Avenue
- 7th Street between 2nd Avenue and 11th Avenue South
- 6th Street between 2nd Ave and Chicago Avenue
- 3rd Street from 5th Avenue S to Chicago Avenue
- Hennepin between 12th Street and 16th Street
- Metropolitan Council, Travel Behavior Inventory, 2019
- Climate Action Plan
- Minneapolis Sustainability Office - Citywide Greenhouse Gas Emissions Inventory
- The vehicles miles traveled reduction is calculated from 2018 baseline data of 2,368,057,420 miles traveled on Minneapolis streets; 1.8% annual reduction needed between 2018 and 2030. Annual vehicle miles traveled data provided by the Minnesota Department of Transportation.
- Minnesota Department of Transportation vehicle miles traveled data reflects all vehicle miles traveled in the City of Minneapolis and does not solely represent vehicle miles traveled for Minneapolis residents. Current population and projected population estimates for Minneapolis residents of all ages were used to calculate daily average mileage.
- https://www.mplsdowntown.com/facts/