ForewordResiliency, Racial Justice and Real-Time Planning
Racial Justice
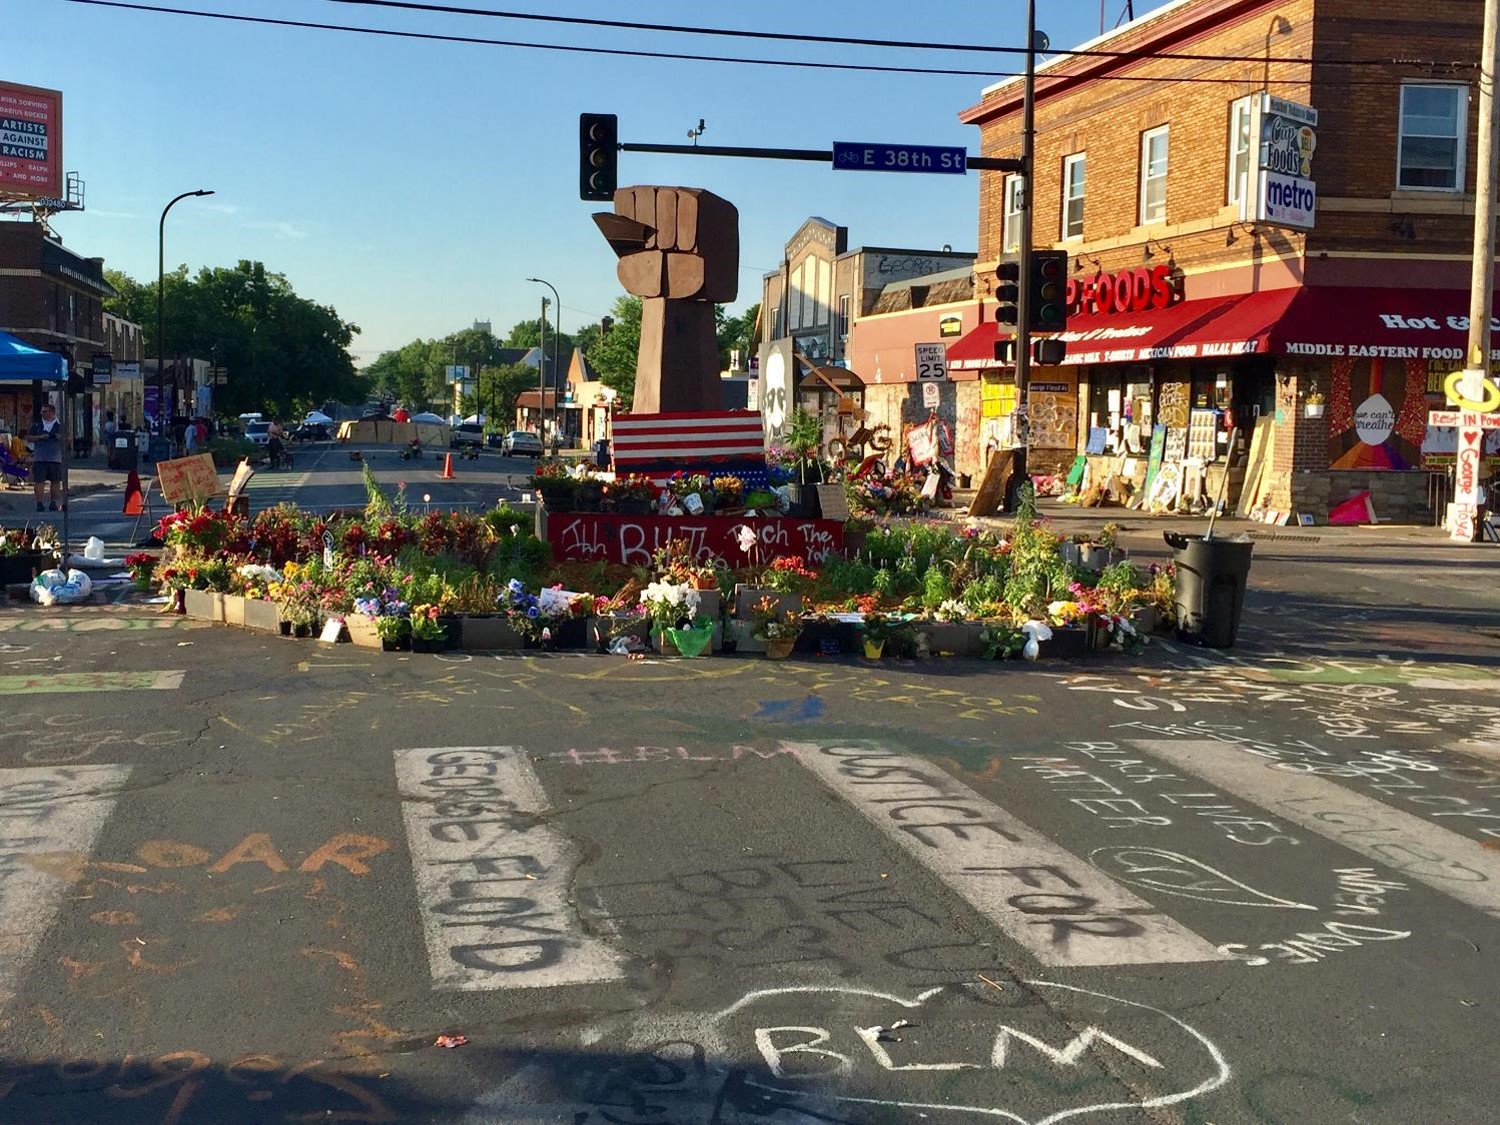
On May 25, George Floyd died while in Minneapolis police custody at the corner of 38th and Chicago Avenue South. His death sparked weeks of protest, riots and civil unrest throughout the city, and a public debate over the role of policing and public safety ensued. There are direct ties to the work of the Transportation Action Plan, as we saw streets turn into sacred places overnight, memorializing the site where George Floyd lost his life; we saw streets with planned investments on them lose the built environment that supports and frames the street; we saw streets emerge as the place for community protest and expression; we saw artwork frame up corridors in beautiful murals, heartbreaking messaging, and calls for change.
Our streets were the backdrop of much that occurred in the summer following the death of George Floyd. Beneath the surface, the impacts and citywide discourse on racial justice have also had impacts on the longerterm planning related to our public streets. Given the citywide conversation around public safety and public feedback on the topic, we re-evaluated how enforcement shows up in the plan and are confident that the actions that speak to enforcement are either administrative in nature (see Walking Action 4.3 on snow clearing), involve parked vehicles (see Transit Action 2.8 on bus only lanes) or have the goal of eliminating traffic stops that involve officer interaction (see Street Operations Action 6.6 on automated enforcement). The Progress section identifies three new strategies – on framing racial equity for transportation, engagement, and evaluation – that address improvements to how we can better connect with and serve the people of Minneapolis.
This plan is built around seven topic areas that largely follow modal planning – walking, bicycling, taking transit, using streets with a vehicle, delivering goods. We know that the way our streets work are not modal-specific, so we also have topics on how technology allows us to leverage outcomes for citywide goals, and how everything comes together through operations and design of our streets. At the core, we are working to create more mobility options for more people so there is less reliance on private vehicles in order to access opportunities in our city.
Average travel time to work (all modes) by race, 2017
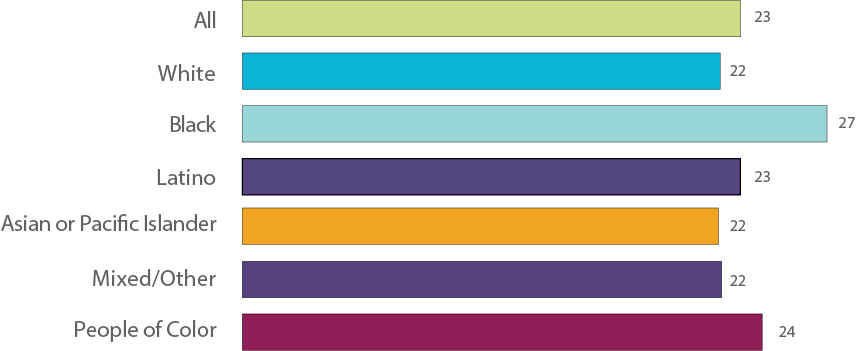
Source: National Equity Atlas, 2017
Our data shows that by focusing on creating more options for people, we are opening up opportunities for low-income and people of color in our community. Key data that make the explicit link between our work and advancing options for people who face economic disadvantages in Minneapolis include:
- 20% of residents live below 100% of the federal poverty thresholds (household income dependent on family size and composition); this number is 41% for black people, 34% for people of color and 12% for white people1
- 26% of residents live in high poverty neighborhoods; this number is 48% for black people, 38% for people of color and 17% for white people2
- 31% people of color households do not have access to a car; this number is 12% for white households3
- Average commute times for white workers is 22 minutes versus 24 minutes for people of color workers and 27 minutes for black workers4
Minneapolis faces some of the gravest racial inequities in the nation. The data above point to how that plays out in transportation options for people. Given this data, it is clear that by focusing on creating more and safer options for people to walk, bike, take transit, and access shared mobility services, we are advancing outcomes that can be directly felt by people experiencing hardship.
Next section: real-time planning